Accounting Updates for Southern Gas Association Accounting
& Financial Executives Conference
Bob
Jensen at Trinity
University
Bob
Jensen's threads on accounting theory are at http://www.trinity.edu/rjensen/theory.htm
Systemic Problems of Accounting and Auditing ---
http://www.trinity.edu/rjensen/FraudConclusion.htm
Equity Valuation in the Oil and Gas Industry
DRILLING DEEPER: MANAGING VALUE AND REPORTING IN THE
PETROLEUM INDUSTRY,
A Special Report from PricewaterhouseCoopers (PwC), 2002 --- http://www.pwc.com/images/gx/eng/about/ind/petro/drilling_deeper.pdf
Executive Summary
The traditional, predominantly financial,
indicators used to measure corporate performance no longer meet the
needs of the global capital markets. They do not tell a company’s
full story and are not adequate to deliver true insight into its
capacity to grow, adapt and change. Our survey of petroleum companies,
investors and analysts, demonstrates the case for more comprehensive
reporting.
Eighty per cent of petroleum companies in the
survey believe their share price falls short of their company’s true
value. But the reporting practices of petroleum companies in turn fall
short of what investors and analysts say they need to assess companies
for investment purposes. Investor feedback revealed that for about
three of every five indicators they highlight as having particular
value in assessing companies, the information flow from companies is
significantly below what they need.
Only a few of the indicators fall into the
category of traditional financial reporting. Instead, they cover
ground such as the geopolitical environment, strategic direction and
quality of management. Investors also express a desire for information
to be better-segmented in the upstream and downstream sectors.
The survey indicates that petroleum companies
need to work more effectively to achieve their investor dialogue
goals. More than half of companies (52 per cent) believe they work
proactively to initiate contact or maintain continuous dialogue with
investors, yet only 14 per cent of investors characterised petroleum
companies in this way.
A shift to more comprehensive reporting will
help petroleum companies move away from the treadmill of continuous
focus on short-term earnings. Investor cynicism about short-term
earnings runs high. Three-quarters of investors feel that petroleum
companies have considerable discretion on earnings figures, yet this
leeway is firmly refuted by companies themselves.
A move to wider reporting is seen by
companies, investors and analysts as likely to lead to tangible gains
for companies. Reduced share-price volatility, increased valuations,
more long-term investment, a lower cost of capital and greater
management credibility are among the benefits of better disclosure
cited by a majority of those surveyed.
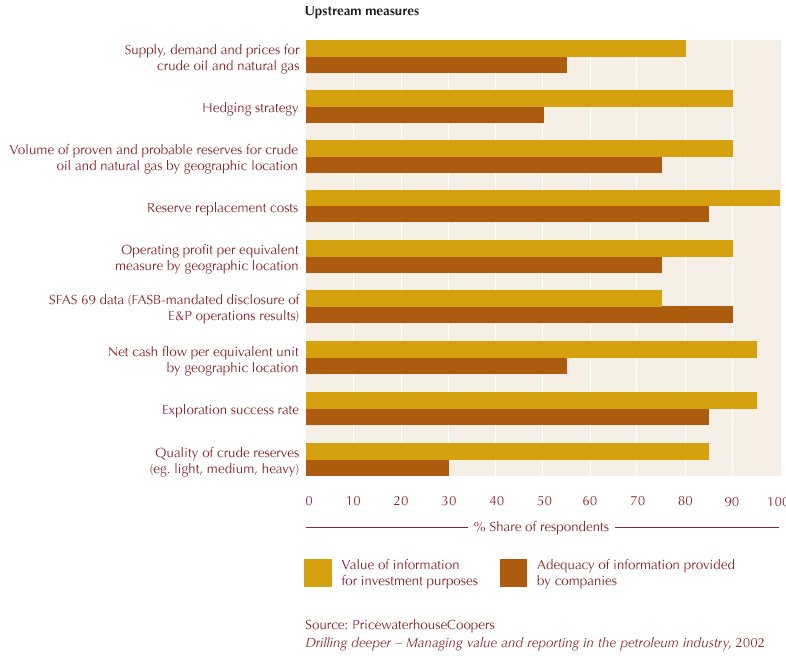
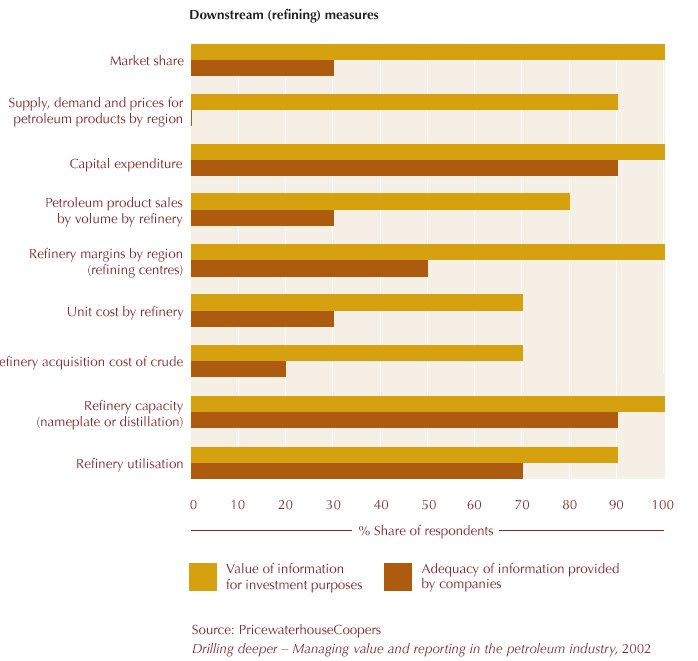
Value indicators – Responses
of analysts for the indicators in the
general, upstream E&P and downstream refining sectors.
 |
Value indicators – Responses
of analysts for the indicators in the
general, upstream E&P and downstream refining sectors.
 |
|
KMPG's eValuation
"Services Calculate Net ROI Consulting firms update traditional business
metrics for Internet" By Chuck Moozakis, Internet Week, August 24, 2000 ---
http://www.internetwk.com/lead/lead082400.htm
Calculating Net ROI
The fledgling oil and
gas exchange PetroCosm knew it needed more than the backing of giants Chevron
and Texaco to win over customers and suppliers. Even more important was the
ability to demonstrate clear financial benefits for participants.
In the months leading
up to its July launch, PetroCosm worked with consulting firm KPMG to develop a
return-on-investment (ROI) model that would help potential customers make the
case for participating in the exchange.
PetroCosm used a new
KPMG service dubbed eValuation--announced last week--that takes into account
traditional ROI variables, such as up-front development costs, as well as more
Internet-centric variables, such as the additional sales that can be derived
by participating in a wide range of online marketplaces. It also factors in
the cross-company ramifications of Internet supply chains and how customers
and suppliers can also benefit.
"We were able to
come up with a business case that said this is a profitable business" for
both suppliers and PetroCosm's founding members, said PetroCosm controller Rod
Starr. "It sounds straightforward enough, but one of the great challenges
is that there are no existing models to gauge ROI."
Armed with results
from the ROI study that indicated the type of cost savings prospective members
could realize by participating in a B2B exchange, PetroCosm has been able to
sell prospective participants on the possibility of trimming anywhere from 5
percent to 20 percent of their procurement costs by joining the marketplace,
Starr said. --Chuck Moozakis
Read the rest: http://www.internetwk.com/lead/lead082400.htm
How might companies
present their financial performance in a better light?
Bob Jensen's Threads on "Core Earnings" Theory and Implementation
--- http://www.trinity.edu/rjensen//theory/00overview/CoreEarnings.htm
Bob Jensen's Threads on Pro Forma Earnings --- http://www.trinity.edu/rjensen//theory/00overview/theory01.htm#ProForma
The New York
Yankees today released their 4th Quarter 2001 pro forma results. Although
generally accepted scorekeeping principles (GASP) indicate that the Yankees lost
Games 1 and 2 of the 2001 World Series, their pro forma figures show that these
reported losses were the result of nonrecurring items, specifically
extraordinary pitching performances by Arizona Diamondbacks personnel Kurt
Schilling and Randy Johnson. Games 3 and 4 results, already indicating Yankee
wins, were not restated on a pro forma basis.
Ed Scribner, New Mexico State
Equity Valuation
Bob Jensen's Threads on Return on Business Valuation, Business Combinations,
Investment (ROI), and Pro Forma Financial Reporting --- http://www.trinity.edu/rjensen/roi.htm
|
Questrom vs. Federated Department Stores, Inc.: A Question of Equity
Value," by Gary Taylor, William Sampson, and Benton Gup, Issues in
Accounting Education, May 2001, pp. 223-256.
This is perhaps the best short case that I've ever read. It will
undoubtedly help my students better understand weighted average cost of capital,
free cash flow valuation, and the residual income model. The three student
handouts are outstanding. Bravo to Taylor, Sampson, and Gup. If you
subscribe to the electronic option of the American Accounting Association, you
can download the case from http://aaahq.org/ic/browse.htm
The market value
represents the firm’s stock price at a given point multiplied by the number of
shares outstanding. The intrinsic value
of the firm is the present value of the forecasted payoffs of income, cash flow,
or other economic variables to the stockholder; thus, the intrinsic value
represents the value implied by avail-able information. The intrinsic value is
the theoretical value of the firm based on any one of a variety of valuation
methods such as free cash flow,
residual income, or dividend
discount. Consequently, wide variation can exist in
estimates of a firm’s intrinsic value.
During the 1980s, a significant amount of research
suggested that financial markets are informationally efficient. However, in
recent years, research has re-vealed many market imperfections. Size and
seasonality effects temper the assumption that stocks are fairly priced at any
given time. In addition, Wall Street spends a considerable amount of time and
money on identifying “mispriced stocks,”
Market Value
Market value is only indirectly affected by limited and/or misleading financial
reports. Traders and investors can look at all other sources of
information setting bid and ask prices. However, only a small proportion
of shares are usually traded and these seldom reflect the value of enormous
blocks of equity, especially blocks that provide ownership control of
management. Also, daily stock prices are heavily influenced by general
market conditions and trends that may be poorly correlated with changes in value
in a particular company. Also daily stock prices are impacted upon by
accounting data news releases that are subject to all the limitations of
accounting data used in computing intrinsic values.
Intrinsic Value
Intrinsic value suffers most from more direct reliance upon what
accountants report in the way of earnings, cash flows, and account
balances. The main limitation is the valuation impact of items not
accounted for such as intellectual capital, quality reputation, brand
recognition, political power/connections, monopoly power, and other
intangibles. Another major problem is that management compensation
contracts contribute to misleading and/or fraudulent manipulation of the
accounting numbers. Further complications include impacts of
extraordinary items in financial statements and early extinguishment of
debt. Enormous problems arise from complicated and obscure
measurement and disclosures under such unfathomable accounting standards
like FAS 133 on Accounting for Derivative Financial Instruments and
Hedging Activities. Many disclosure footnotes such as the infamous
Footnote 16 of the Enron 2000 annual report cannot be understood by top
experts --- http://www.trinity.edu/rjensen/fraud.htm#Senator
- Discounted Dividend (DD)Valuation:
In theory, the best economic value is the present value of all
future cash flows (dividends) on each share of common stock.
Since many firms do not pay dividends or pay miniscule dividends,
the ability to pay a dividend must be used as a surrogate for
dividends. This in turn leads to the FCF surrogate described
below.
- Free Cash Flow (FCF)
Valuation:
"Free cash flow" is the amount of cash remaining from
operations after cash is used
for new investments. It is the cash theoretically avail-able to
pay bondholders and shareholders. It is calculated as the sum of
"net cash provided
from operating activities," after adding back after-tax net
interest payments, less
(plus) "cash used for (generated from) investing
activities." The resulting amount
is the cash available to pay bondholders or shareholders, i.e.,
"free cash
flow."
- FCF is not a true measure of value created since cash outflows
for investing activities reduce FCF. However, as long as the
company is not investing in negative NPV projects, investing
activities should increase firm value. Problems with the FCF
model are evident for firms whose FCFs have not reached a steady
state. For these firms, it is difficult to predict the timing of
future investing activities, making it difficult to predict
expected future free cash flows. If these firms are successful,
they will ultimately incur positive free cash flows, but only in
the future, when returns from their investment are
realized.
- Wal-Mart illustrates the problems associated with using the
FCF model to estimate the intrinsic value of a firm whose FCFs
have not reached a steady state. From 1988 through 1996,
Wal-Mart’s FCFs were positive only in 1989. The negative FCF
amounts during these years were due to the large outflows of
cash used to expand its retail stores; these outflows for
investing activities exceeded Wal-Mart’s operating cash flow.
Despite its negative FCFs, Wal-Mart’s price per share
increased from $6.875 in 1988 to $20.375 in 1996. In addition,
Wal-Mart notes in its 2000 annual report plans to expand in
international markets, thereby making additional negative free
cash flows likely for the foreseeable future. Yet the price per
share continues to increase.
- Residual Income (RI) or "Abnormal Earnings"
Valuation:
“Residual Income” is the earnings above “normal earnings.”
“Normal earnings” are the required earnings expected by
investors, given the cost of capital, and is calculated by
multiplying the beginning-of-the-period book value of equity (Bt–1
) by the firm’s cost of capital (r). Mathematically, residual
income for period t is from forecasted eps estimates (fepst
– rBt–1 ) where fepst is forecasted
earnings for period t. Residual earnings are also called “abnormal
earnings.”
Residual Income Model:
The “Residual Income” (RI) model is a valuation tool that is
derived directly from the discounted dividend model. The RI model
estimates intrinsic value by looking at both “stocks” (balance
sheet equity amounts) and “flows” (earnings). The RI model
estimates a firm’s total equity value as a function of the book
value of common equity and the present value of residual income. The
mathematical relationship between per-share forecasted earnings,
share price, and book value is: P0 = B0 +
Sum[(1 + r) –t (feps t – rB t–1 )], where P0
and B0 represent today’s price per share and book value
per share of equity, respectively. Cost of capital is defined as r
and forecasted earnings per share as “feps.”
Federated's
Valuation Estimates Using the Free Cash Flow (FCF) Model
Subtracting Deferred Taxes
Table 1
on Page 251 when the share price on January28, 1995 was $18.625
| |
Intrinsic
Value (IV)
Per Share |
Intrinsic
Value (IV)
Per Share |
Intrinsic
Value (IV)
Per Share |
| Discount
Rate |
No
Perpetuity
1995-1999 |
Perpetuity |
Growing
in Perpetuity |
| 5% |
$(30.80) |
$93.22 |
$279.26 |
| 10% |
$(33.15) |
$18.34 |
$40.40 |
| 15% |
$(35.07) |
$(
6.34) |
$
0.84 |
|
Federated's
Valuation Estimates Using the Residual Income (RI) Model
Table 2
on Page 252 when the share price on January28, 1995 was $18.625
| |
Intrinsic
Value (IV)
Per Share |
Intrinsic
Value (IV)
Per Share |
Intrinsic
Value (IV)
Per Share |
| Discount
Rate |
No
Perpetuity
1995-1999 |
Perpetuity |
Growing
in Perpetuity |
| 5% |
$23.33 |
$62.64 |
$121.59 |
| 10% |
$19.37 |
$27.24 |
$30.61 |
| 15% |
$16.21 |
$15.89 |
$18.81 |
|
The share price on April 3, 2003 was $28.50. There are no
dividends.
|
FASB Standards of Particular Interest
Statement No. 148
Accounting for Stock-Based Compensation—Transition and Disclosure—an
amendment of FASB Statement No. 123
(Issue Date 12/02)
[Summary] [Status]
Statement No. 147
Acquisitions of Certain Financial Institutions—an amendment of FASB
Statements No. 72 and 144 and FASB Interpretation No. 9
(Issue Date 10/02)
[Summary] [Status]
Statement No. 146
Accounting for Costs Associated with Exit or Disposal Activities
(Issue Date 6/02)
[Summary] [Status]
Statement No. 145
Rescission of FASB Statements No. 4, 44, and 64, Amendment of FASB
Statement No. 13, and Technical Corrections
(Issue Date 4/02)
[Summary] [Status]
Statement No. 144
Accounting for the Impairment or Disposal of Long-Lived Assets
(Issue Date 8/01)
[Summary] [Status]
Statement No. 143
Accounting for Asset Retirement Obligations
(Issue Date 6/01)
[Summary] [Status]
Statement No. 142
Goodwill and Other Intangible Assets
(Issue Date 6/01)
[Summary] [Status]
Statement No. 141
Business Combinations
(Issue Date 6/01)
[Summary] [Status]
Statement No. 140
Accounting for Transfers and Servicing of Financial Assets and
Extinguishments of Liabilities-a replacement of FASB Statement No. 125
(Issue Date 9/00)
[Summary] [Status]
Statement No. 139
Rescission of FASB Statement No. 53 and amendments to FASB Statements No.
63, 89, and 121
(Issue Date 6/00)
[Summary] [Status]
Statement No. 138
Accounting for Certain Derivative Instruments and Certain Hedging
Activities-an amendment of FASB Statement No. 133
(Issue Date 6/00)
[Status]
Statement No. 137
Accounting for Derivative Instruments and Hedging Activities—Deferral of
the Effective Date of FASB Statement No. 133—an amendment of FASB Statement
No. 133
(Issue Date 6/99)
[Status]
Statement No. 136
Transfers of Assets to a Not-for-Profit Organization or Charitable Trust
That Raises or Holds Contributions for Others
(Issue Date 6/99)
[Summary] [Status]
Statement No. 135
Rescission of FASB Statement No. 75 and Technical Corrections
(Issue Date 2/99)
[Summary] [Status]
Statement No. 134
Accounting for Mortgage-Backed Securities Retained after the
Securitization of Mortgage Loans Held for Sale by a Mortgage Banking
Enterprise—an amendment of FASB Statement No. 65
(Issue Date 10/98)
[Status]
Statement No. 133
Accounting for Derivative Instruments and Hedging Activities
(Issue Date 6/98)
[Summary] [Status]
Statement No. 132
Employers' Disclosures about Pensions and Other Postretirement
Benefits—an amendment of FASB Statements No. 87, 88, and 106
(Issue Date 2/98)
[Summary] [Status]
Statement No. 131
Disclosures about Segments of an Enterprise and Related Information
(Issue Date 6/97)
[Summary] [Status]
Statement No. 130
Reporting Comprehensive Income
(Issue Date 6/97)
[Summary] [Status]
Further disconnects income statement from the balance sheet
Free from the FASB
Accounting for Stock-Based Compensation: A Comparison of FASB Statement No. 123,
Accounting for Stock-Based Compensation, and Its Related Interpretations,
and IASB Proposed IFRS, Share-based Payment (Invitation to Comment)
November 18, 2002
(Comment period ends February 1, 2003)
[Download]
--- http://www.fasb.org/draft/itc_intropg_stock_based_comp.shtml
Note that adjustments for many more companies are available in the "Core
Earnings" revisions from Standard and Poors at http://www2.standardandpoors.com/NASApp/cs/ContentServer?pagename=sp/Page/PressSpecialCoveragePg&b=5&r=1&s=3&ig=1026841911315
I also created the shorter URL --- http://snurl.com/CoreEarnings
In response to growing concern about companies
earnings reports, Standard & Poor’s has introduced a new methodology
called “Standard & Poor’s Core Earnings.” The ultimate goal is to
lead investors and analysts to a consensus on earnings calculations, and bring
more transparency and consistency to earnings analysis and forecasts.
Bob Jensen's threads on these this controversy can be found at http://www.trinity.edu/rjensen/theory/sfas123/jensen01.htm
New
FASB Now Expects to Issue the proposed limited-scope statement, Accounting for
Certain Financial Instruments with Characteristics of Both Liabilities and
Equity, in the second quarter of 2003
Project Update --- http://www.fasb.org/project/liabeq.shtml
RECENT DEVELOPMENTS
- The Board issued two FASB Exposure Drafts, Accounting
for Financial Instruments with Characteristics of Liabilities, Equity, or
Both, and Proposed Amendment to FASB Concepts Statement No. 6 to
Revise the Definition of Liabilities, on October 27, 2000. (Copies of
both Exposure
Drafts may be downloaded from this Website, along with the
analysis of the proposed Statement’s impact on EITF consensuses.) The
Board began its redeliberations of the issues in the Exposure Drafts in
the light of comments received on those Exposure Drafts, in December 2001,
starting out with issues addressing separation of compound instruments.
Accounting for Financial Instruments with Characteristics of
Liabilities, Equity, or Both (Proposed Statement of Financial
Accounting Standards)
October 27, 2000
Exposure Draft
[Download] --- http://www.fasb.org/draft/ed-fi.pdf
EITF
Analysis --- http://www.fasb.org/draft/eitfliabeq.shtml
- On June, 5, 2002, before resolving the separation
issues, the Board decided to change the order of issues it would address
in its redeliberations so that it could immediately address concerns
relating to financial instruments embodying obligations that could be
settled by the issuance of an entity’s own shares. After redeliberating
those issues, on November 13, 2002, the Board decided to issue a
limited-scope Statement addressing the following instruments:
- Financial instruments embodying, or indexed
to, an obligation to repurchase an issuer’s equity shares that
requires or could require settlement by transfer of assets
- Mandatorily redeemable instruments
- Financial instruments embodying an obligation
that the issuer must or could settle by issuing a variable number of
its equity shares if the monetary value of the obligation is based
solely or predominantly on (a) a fixed monetary amount known at
inception, (b) variations in something other than the fair value of
the issuer’s equity shares, or (c) variations in the fair value of
the issuer’s equity shares, but in the direction opposite to those
variations.
- The Board decided to issue a final Statement. The
Board believes that rapid issuance of the Statement, even though
separation and conceptual issues affecting other instruments are not yet
resolved, is needed to provide timely and necessary guidance for certain
troublesome instruments.
April 2, 2003 message from Terry Bechtel [bechtelt@nsula.edu]
Dr. Jensen,
I would suggest that the use of 3-D and 4-D seismic is of significance. I am
told that the probability of success when an oil well is drilled is now about
75%. In the past successful wells occurred about one time in nine and even less
frequently in wildcat situations. It would seem to me that this might have
implications regarding the use of the full-cost versus the successful efforts
methods of accounting. I hope that you find this useful. Also please say hello
to Petrea for me as we are old friends.
Terry B.
Comparisons of International IAS Versus FASB Standards --- http://www.deloitte.com/dtt/cda/doc/content/pocketiasus.pdf
SEC Proposed Rule: on Disclosure in Management's Discussion and Analysis
about the Application of Critical Accounting Policies --- http://www.sec.gov/rules/proposed/33-8098.htm
(Relates to the older FR-60)
- Basic information needed to understand estimates, such as the underlying
methodology and assumptions
- Effect of estimates on financial presentation
- Sensitivity of the financial results to changes in the estimates or their
underlying assumptions
- Statement as to whether or not management discussed the development,
selection, and disclosure of the estimates with the company’s audit
committee
- Requires management to make assumptions about matters that are “highly
uncertain” at the time the estimate is made, and it must be an estimate
for which different estimates reasonably could have been used, or changes
are reasonably likely to occur, that would have a material impact on
financial results
- Examples
- Revenue recognition policies and methods
- Related party transactions
- Valuation of investments
- Debt and debt covenants
- Deferred tax assets
- Commitments and contingencies
- Oil and gas reserves (Plans to develop PUDs, Proved Undeveloped
Reserves)
- Impairment of oil and gas properties (significance of probable/
possible reserves)
What's Right and What's Wrong With (SPEs),
SPVs, and VIEs --- http://www.trinity.edu/rjensen//theory/00overview/speOverview.htm
FIN
46
Revised
FIN 46 Interpretation of Accounting Research Bulletin No. 51, Consolidated
Financial Statements,
Consolidation of VIEs on the basis of risk rather than voting control
From the January 17, 2003 FEI Express
Those
FEI members whose companies have November 30 or December 31 fiscal year-ends
need to take a close look at FASB Interpretation No. 46, Consolidation of
Variable Interest Entities, as soon as possible for two reasons: (1) FIN 46
has disclosure requirements that become effective for financial statements
issued after January 31, 2003; (2) FIN 46 applies to all types of
unconsolidated entities (e.g., joint ventures, partnerships, cost basis
investments, etc.). For those who have not followed this project closely, FIN
46 could affect your company's financial statements even if it has no
involvement with so-called "special purpose entities" (SPEs). The
following is a brief synopsis of the rule. The complete document is available
now at the FASB's web site at: http://www.fasb.org/interp46.pdf.
Transactions that will come
under FIN 46 scrutiny include the following:
-
off-balance-sheet
R&D ventures,
-
synthetic leases,
-
asset-backed commercial
paper,
-
collateralized debt
obligation, and
-
exploration ventures,
-
others.
FR-61 SEC Disclosure in Management's Discussion and Analysis About
Off-Balance Sheet Arrangements, Contractual Obligations and Contingent
Liabilities and Commitments
- Off balance sheet arrangements (SPEs, VIEs)
- Contractual obligations and commercial commitments
- Energy trading activities
- Related party transactions
FAS 133 and IAS 39 --- Accounting for Financial Instruments Derivatives
and Hedging Activities
- Fair Value Hedges (Inventory On Hand, Firm Commitments, Tolling, Capacity,
Transportation Agreements, Fixed Rate Debt)
- Cash Flow Hedges (Forecasted Transactions Other Than Derivatives, Interest
Rate Risk)
- Normal Purchases, Normal Sales
- Terminating cash flow hedges is not an earning event --- No basis
adjustment
- EITF Topic D-102 Documentation
- The hedging instrument
- The hedged item
- The nature of the risk being hedged
- Prospective and retrospective effectiveness tests
- Post-Enron meltdown of energy trading sector
- Credit downgrades will affect fair value measurements
- Tighter watch on what qualifies for hedge accounting
- Netting of Financial Contracts --- http://www.mccannfitzgerald.ie/legal_briefing/banking_financial_services/netting_protection.html
One objective of risk management in the context of
derivatives transactions is to reduce overall credit risk, by using netting
agreements to set off the market value of gains and losses on transactions.
Netting agreements provide for the termination of the transactions in specified
circumstances (including insolvency circumstances), provide a mechanism for
valuing the lost economic value and related termination costs of the terminated
transactions and aggregate those individual values/costs to a single net sum.
Only the net sum arising is then payable. Without netting, in an insolvency
situation, a non-defaulting party may have to pay in full in respect of the
out-of-the-money transactions whilst, as an ordinary creditor, receiving little
or nothing in respect of the in-the-money transactions.
FAS 143 --- Accounting for Asset Retirement Obligations
- The new rule requires businesses to record the fair value of a liability
for an asset retirement obligation in the period in which it is incurred.
When the liability is initially recorded, the entity capitalizes a cost by
increasing the carrying amount of the related long-lived asset. Over time,
the liability is accreted to its present value each period, and the
capitalized cost is depreciated over the useful life of the related asset.
Upon settlement of the liability, an entity either settles the obligation
for its recorded amount or incurs a gain or loss upon settlement.
- Measure the liability at fair value
- Methodology will be a change for many oil and gas companies
- Most do not discount the liability and recognize accretion expense
- Most do not measure the liability at fair value
- Many do not gross up the balance sheet (i.e., the liability is
embedded in accumulated depletion, depr., and amortization (DD&A)
- Many assume salvage value of surface equipment will offset reclamation
costs
FAS 146 --- Accounting for Costs Associated with Exit or Disposal
Activities
- This Statement addresses financial accounting and reporting for costs
associated with exit or disposal activities and nullifies Emerging Issues
Task Force (EITF) Issue No. 94-3, "Liability Recognition for Certain
Employee Termination Benefits and Other Costs to Exit an Activity (including
Certain Costs Incurred in a Restructuring)."
- The Board decided to address the accounting and reporting for costs
associated with exit or disposal activities because entities increasingly
are engaging in exit and disposal activities and certain costs associated
with those activities were recognized as liabilities at a plan (commitment)
date under Issue 94-3 that did not meet the definition of a liability in
FASB Concepts Statement No. 6, Elements of Financial Statements.
- The principal difference between this Statement and Issue 94-3 relates to
its requirements for recognition of a liability for a cost associated with
an exit or disposal activity. This Statement requires that a liability for a
cost associated with an exit or disposal activity be recognized when the
liability is incurred. Under Issue 94-3, a liability for an exit cost as
defined in Issue 94-3 was recognized at the date of an entity’s commitment
to an exit plan. A fundamental conclusion reached by the Board in this
Statement is that an entity’s commitment to a plan, by itself, does not
create a present obligation to others that meets the definition of a
liability. Therefore, this Statement eliminates the definition and
requirements for recognition of exit costs in Issue 94-3. This Statement
also establishes that fair value is the objective for initial measurement of
the liability.
- Applies to costs of terminating contracts and closing or consolidating
facilities
EITF 98-10 --- Rescinded
Reversal of mark-to-market gains on certain energy contracts to reflect the
rescinding of Emerging Issues Task Force (EITF) Issue No. 98-10, “Accounting
for Contracts Involved in Energy Trading and Risk Management Activities”
- Non-derivatives no longer marked to market (e.g., storage contracts,
tolling agreements, capacity contracts, inventory)
- Fair value accounting model for inventory challenged
- Disclosures no longer required
- Valuation and disclosure to be taken up later by the FASB
FIN 45 --- Guarantor’s Accounting and Disclosure requirements for
Guarantees, Including Indirect Guarantees of Indebtedness of Others
The Interpretation should significantly improve the reporting of guarantees
that are issued in conjunction with other transactions, such as when a seller
also guarantees its customer’s repayment of the funds borrowed to pay the
seller for the customer’s purchases.” This guidance does not apply to
certain guarantee contracts, such as those issued by insurance companies or for
a lessee’s residual value guarantee embedded in a capital lease. The
provisions related to recognizing a liability at inception of the guarantee for
the fair value of the guarantor’s obligations would not apply to product
warranties or to guarantees accounted for as derivatives.
Ceiling/Impairment Tests
• Accounting Standards IAS 36, FRS 11 and FAS 121
Accounting For Decommissioning/Site Restoration
• Accounting Standards IAS 37, FRS 12, and US GAAP
Impact Of Accounting Policy Choices
Analysis Of Oil And Gas Company Financial
Statements
Financing Arrangements
• Accounting for farm ins/farm outs and carried interests
Sales Revenue Accounting
• Accounting for overlift and underlift
• Accounting for take or pay sales agreements
Pending Revision of FAS 123
Stock Options
If the FASB and the IASB require expensing of stock options when vested rather
than exercised, it will have really adverse effects on the bottom lines of some
companies who rely heavily upon employee stock options for compensation.
This is why the U.S. House and Senate are already gearing up for a fight with
the FASB and possibly SEC due to heavy lobbying pressures. In the March
31, 2003 issue of Barron's on Page 28, the following sample impacts are
provided:
|
Adjusting Earnings for Options
»Earnings of major tech
companies are well below reported levels when adjusted for option
grants to employees. Options will become a big issue next year when
companies likely will be forced to record them as an expense. Some
companies, like Microsoft, are reducing option grants, helping
shareholders.
|
| Company |
Microsoft |
Intel |
IBM |
Cisco |
Oracle |
Applied
Materials |
EMC |
Hewlett-Packard |
Texas
Instruments |
| Recent Stock Price |
$25.04 |
17.58 |
81.45 |
13.5 |
11.36 |
13.5 |
7.16 |
16.44 |
17.75 |
| 2002 Earnings* |
$0.92 |
0.51 |
3.95 |
0.39 |
0.41 |
0.19 |
-0.05 |
0.79 |
0.22 |
| Option-adjusted'02 Profits* |
$0.71 |
0.34 |
3.28 |
0.19 |
0.33 |
0 |
-0.22 |
0.48 |
-0.01 |
| 2002 P/E Ratio |
27.2 |
34.5 |
20.6 |
34.6 |
27.7 |
67.5 |
NM |
20.8 |
80.7 |
| 2002 Option-adjusted P/E |
35.3 |
51.7 |
24.8 |
71.1 |
34.4 |
NM |
NM |
34.3 |
NM |
| 2002 Options Grant (mil) |
82 |
174 |
60 |
282 |
63 |
9 |
52 |
66 |
37 |
| Options Grant Relative to Shares
Outstanding |
0.8% |
2.6 |
3.5 |
3.8 |
1.2 |
0.5 |
2.4 |
2.2 |
2.1 |
| Options Issuance Trend |
ä |
ä |
ã |
ä |
ä |
ä |
ä |
ã |
ã |
| *2002 Fiscal Year.
NM-Not meaningful.
Sources: Company reports; Thomson/Baseline |
See Bob Jensen's letter to Senator
Charles E. Schumer --- http://www.trinity.edu/rjensen/theory/sfas123/jensen01.htm
(Includes updates not sent to Senator Schumer)
S&P Core Earnings Theory --- http://www.trinity.edu/rjensen//theory/00overview/CoreEarnings.htm
"Bubble Redux," by Andrew Bary, Barron's, April 14, 2003,
Page 17.
Amazon's valuation is the most
egregious of the 'Net trio. It trades for 80 times projected "pro
forma" 2003 profit of 32 cents a share. Amazon's pro forma
definition of profit, moreover, is dubious because it excludes re-structuring
charges and, more important, the restricted stock that Amazon now is issuing
to employees in lieu of stock options. Amazon's reported profit this
year under generally accepted accounting principles (which include
restricted-stock costs) could be just 10 cents to 15 cents a share, meaning
that Amazon's true P/E arguably is closer to 200.
Yahoo, meanwhile, now commands
70 times estimated 2003 net of 35 cents a share, and eBay fetches 65 times
projected 2003 net of $1.35 a share.
What's fair value? By our
calculations, Amazon is worth, at best, roughly 90% of its projected 2003
revenue of $4.6 billion. That translates into $10 a share, or $4.1 billion.
This estimate is charitable because the country's two most successful
brick-and-mortar retailers, Wal-Mart Stores and Home Depot, also
trade for about 90% of 2003 sales.
Yahoo ought to trade closer to
15. That's a stiff 43 times projected 2003 earnings and gives the
company credit for its strong balance sheet, featuring over $2 a share in cash
and another $3 a share for its stake in Yahoo Japan, which has become that
country's eBay.
Sure, eBay undoubtedly is the
most successful Internet company and the only one that has lived up to the
growth projections made during the Bubble. As the dominant online
marketplace in the U.S. and Europe, eBay saw its earnings surge to 87 cents a
share last year from three cents in 1998, when it went public at a
split-adjusted $3.00 a share.
Why would eBay be more fairly
valued around 60, its price just several months ago? At 60, eBay would
trade at 44 times projected 2003 profit of $1.35 a share and 22 times an
optimistic 2005 estimate of $2.75. So confident are analysts about
eBay's outlook that they're comfortable valuing the stock on a 2005 earnings
estimate.
Fans of eBay believe its profit
can rise at a 35% annual clip in the next five years, a difficult rate for any
company to maintain, even one, such as eBay, with a "scalable"
business model that allows it to easily accommodate more transactions while
maintaining its enviable gross margins of 80%. If the company earns $5 a
share in 2007--nearly six times last year's profit--it would still trade at 18
times that very optimistic profit level.
Continued in the article.
Bob Jensen's threads on pro forma earnings are at http://www.trinity.edu/rjensen//theory/00overview/theory01.htm#ProForma
Equity Valuation
Bob Jensen's Threads on Return on Business Valuation, Business Combinations,
Investment (ROI), and Pro Forma Financial Reporting --- http://www.trinity.edu/rjensen/roi.htm
|
Questrom vs. Federated Department Stores, Inc.: A Question of Equity
Value," by Gary Taylor, William Sampson, and Benton Gup, Issues in
Accounting Education, May 2001, pp. 223-256.
This is perhaps the best short case that I've ever read. It will
undoubtedly help my students better understand weighted average cost of capital,
free cash flow valuation, and the residual income model. The three student
handouts are outstanding. Bravo to Taylor, Sampson, and Gup. If you
subscribe to the electronic option of the American Accounting Association, you
can download the case from http://aaahq.org/ic/browse.htm
The market value
represents the firm’s stock price at a given point multiplied by the number of
shares outstanding. The intrinsic value
of the firm is the present value of the forecasted payoffs of income, cash flow,
or other economic variables to the stockholder; thus, the intrinsic value
represents the value implied by avail-able information. The intrinsic value is
the theoretical value of the firm based on any one of a variety of valuation
methods such as free cash flow,
residual income, or dividend
discount. Consequently, wide variation can exist in
estimates of a firm’s intrinsic value.
During the 1980s, a significant amount of research
suggested that financial markets are informationally efficient. However, in
recent years, research has re-vealed many market imperfections. Size and
seasonality effects temper the assumption that stocks are fairly priced at any
given time. In addition, Wall Street spends a considerable amount of time and
money on identifying “mispriced stocks,”
Market Value
Market value is only indirectly affected by limited and/or misleading financial
reports. Traders and investors can look at all other sources of
information setting bid and ask prices. However, only a small proportion
of shares are usually traded and these seldom reflect the value of enormous
blocks of equity, especially blocks that provide ownership control of
management. Also, daily stock prices are heavily influenced by general
market conditions and trends that may be poorly correlated with changes in value
in a particular company. Also daily stock prices are impacted upon by
accounting data news releases that are subject to all the limitations of
accounting data used in computing intrinsic values.
Intrinsic Value
Intrinsic value suffers most from more direct reliance upon what
accountants report in the way of earnings, cash flows, and account
balances. The main limitation is the valuation impact of items not
accounted for such as intellectual capital, quality reputation, brand
recognition, political power/connections, monopoly power, and other
intangibles. Another major problem is that management compensation
contracts contribute to misleading and/or fraudulent manipulation of the
accounting numbers. Further complications include impacts of
extraordinary items in financial statements and early extinguishment of
debt. Enormous problems arise from complicated and obscure
measurement and disclosures under such unfathomable accounting standards
like FAS 133 on Accounting for Derivative Financial Instruments and
Hedging Activities. Many disclosure footnotes such as the infamous
Footnote 16 of the Enron 2000 annual report cannot be understood by top
experts --- http://www.trinity.edu/rjensen/fraud.htm#Senator
- Discounted Dividend (DD)Valuation:
In theory, the best economic value is the present value of all
future cash flows (dividends) on each share of common stock.
Since many firms do not pay dividends or pay miniscule dividends,
the ability to pay a dividend must be used as a surrogate for
dividends. This in turn leads to the FCF surrogate described
below.
- Free Cash Flow (FCF)
Valuation:
"Free cash flow" is the amount of cash remaining from
operations after cash is used
for new investments. It is the cash theoretically avail-able to
pay bondholders and shareholders. It is calculated as the sum of
"net cash provided
from operating activities," after adding back after-tax net
interest payments, less
(plus) "cash used for (generated from) investing
activities." The resulting amount
is the cash available to pay bondholders or shareholders, i.e.,
"free cash
flow."
- FCF is not a true measure of value created since cash outflows
for investing activities reduce FCF. However, as long as the
company is not investing in negative NPV projects, investing
activities should increase firm value. Problems with the FCF
model are evident for firms whose FCFs have not reached a steady
state. For these firms, it is difficult to predict the timing of
future investing activities, making it difficult to predict
expected future free cash flows. If these firms are successful,
they will ultimately incur positive free cash flows, but only in
the future, when returns from their investment are
realized.
- Wal-Mart illustrates the problems associated with using the
FCF model to estimate the intrinsic value of a firm whose FCFs
have not reached a steady state. From 1988 through 1996,
Wal-Mart’s FCFs were positive only in 1989. The negative FCF
amounts during these years were due to the large outflows of
cash used to expand its retail stores; these outflows for
investing activities exceeded Wal-Mart’s operating cash flow.
Despite its negative FCFs, Wal-Mart’s price per share
increased from $6.875 in 1988 to $20.375 in 1996. In addition,
Wal-Mart notes in its 2000 annual report plans to expand in
international markets, thereby making additional negative free
cash flows likely for the foreseeable future. Yet the price per
share continues to increase.
- Residual Income (RI) or "Abnormal Earnings"
Valuation:
“Residual Income” is the earnings above “normal earnings.”
“Normal earnings” are the required earnings expected by
investors, given the cost of capital, and is calculated by
multiplying the beginning-of-the-period book value of equity (Bt–1
) by the firm’s cost of capital (r). Mathematically, residual
income for period t is from forecasted eps estimates (fepst
– rBt–1 ) where fepst is forecasted
earnings for period t. Residual earnings are also called “abnormal
earnings.”
Residual Income Model:
The “Residual Income” (RI) model is a valuation tool that is
derived directly from the discounted dividend model. The RI model
estimates intrinsic value by looking at both “stocks” (balance
sheet equity amounts) and “flows” (earnings). The RI model
estimates a firm’s total equity value as a function of the book
value of common equity and the present value of residual income. The
mathematical relationship between per-share forecasted earnings,
share price, and book value is: P0 = B0 +
Sum[(1 + r) –t (feps t – rB t–1 )], where P0
and B0 represent today’s price per share and book value
per share of equity, respectively. Cost of capital is defined as r
and forecasted earnings per share as “feps.”
Federated's
Valuation Estimates Using the Free Cash Flow (FCF) Model
Subtracting Deferred Taxes
Table 1
on Page 251 when the share price on January28, 1995 was $18.625
| |
Intrinsic
Value (IV)
Per Share |
Intrinsic
Value (IV)
Per Share |
Intrinsic
Value (IV)
Per Share |
| Discount
Rate |
No
Perpetuity
1995-1999 |
Perpetuity |
Growing
in Perpetuity |
| 5% |
$(30.80) |
$93.22 |
$279.26 |
| 10% |
$(33.15) |
$18.34 |
$40.40 |
| 15% |
$(35.07) |
$(
6.34) |
$
0.84 |
|
Federated's
Valuation Estimates Using the Residual Income (RI) Model
Table 2
on Page 252 when the share price on January28, 1995 was $18.625
| |
Intrinsic
Value (IV)
Per Share |
Intrinsic
Value (IV)
Per Share |
Intrinsic
Value (IV)
Per Share |
| Discount
Rate |
No
Perpetuity
1995-1999 |
Perpetuity |
Growing
in Perpetuity |
| 5% |
$23.33 |
$62.64 |
$121.59 |
| 10% |
$19.37 |
$27.24 |
$30.61 |
| 15% |
$16.21 |
$15.89 |
$18.81 |
|
The share price on April 3, 2003 was $28.50. There are no
dividends.
|