
Class 16 Notes
(notes are in progress and are subject to change)
|
|
|
Class 16 Outline:
<Log On>
Discourse
Minimize Discourse
Midterm E`xam Review
Copy 16data from Class folder to your shared folder in Groups
Watermarks - demonstrate on practice word document on desktop
Analyze midterm grades on spreadsheet
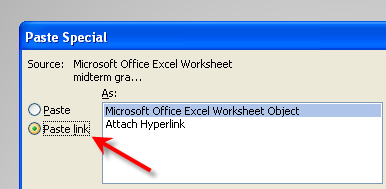
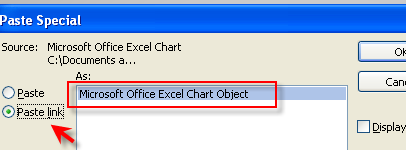
Linking Data Between Office Applications -
(Excel and PowerPoint)
1. compute the total points
2. compute grade and format as % with 2 decimal places
3. sort the grades from highest to lowest
4. compute the mean, mode, and standard deviation for parts and total - (the practical value of understanding the standard deviation of a set of values is in appreciating how much variation there is away from the "average" (mean)).
5. compute the median grade for parts and total
6. make a frequency table using intervals of 5 points (already done)
7. make a column chart of the frequency table
8. insert rows at top of sheet for title, name, computer #, class time
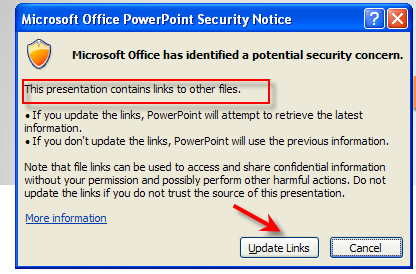
9. make a PowerPoint presentation linking data (save in: 16data, file name:data) - open and close slide to make sure links work
 |
 |
|
|
 |
In Class - Open the folder called 09tigertutorial and then open the document called Resolution and file Size. Follow the directions in class.
Homework:
1. Complete Power Point Presentation using dynamic links, save it in 16data (Most of this will have been done in class)2. Blog Update: Write a meaningful entry on your experience using Excel (10) - e. g., what you learned that you didn't know before, how you might use it in the future, why it is a useful application for some academic fields and businesses.
Optional but strongly suggested: Download Photoshop Elements Free 30-Day Trial from the websites, below. Come to class on Thursday ready to report any problems or concerns
- PSE8 Windows Trial Version
- PSE8 Mac Trial Version
<Log Off>