
Class 15 Notes
(notes are in progress and are subject to change)
|
|
|
Class 16 Outline:
<Log On>
Discourse
Minimize Discourse
Midterm Exam Review
Copy 15data from Class folder to your shared folder in Groups
Analyze midterm grades on spreadsheet
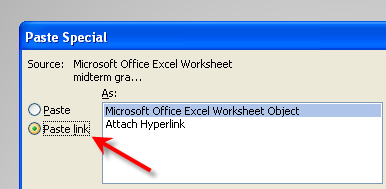
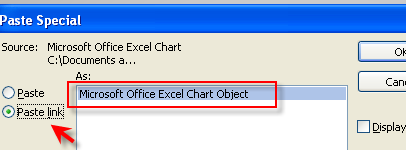
Linking Data Between Office Applications -
(Excel and PowerPoint)
1. compute the total points
2. compute grade and format as % with 2 decimal places
3. sort the grades from highest to lowest
4. compute the mean, mode, and standard deviation for parts and total - (the practical value of understanding the standard deviation of a set of values is in appreciating how much variation there is away from the "average" (mean)).
5. compute the median grade for parts and total
6. make a frequency table using intervals of 5 points (already done)
7. make a column chart of the frequency table
8. insert rows at top of sheet for title, name, computer #, class time
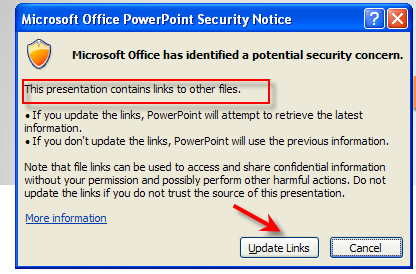
9. make a PowerPoint presentation linking data (save in: 15data, file name:data) - open and close slide to make sure links work
 |
 |
|
|
 |
In Class- PSE Content and Special Effects
Painting color onto black and white
Postcard Introduction - DC PIcs
Part 1. Collect five pictures of your hometown from any source that is not copyrighted. Save them in the Hometown Pics folder inside 15data. Pay attention to the resolution (ppi). We will use these for the hometown postcard assignment.
Part 2. Make a short blog entry on reasons to hate PowerPoint. Try to remember and describe a really awful presentation that you were forced to sit through. Your entry should be one short introductory paragraph and four or five things you hate about bad PPT presentations.
Here are a couple of examples:
http://www.divinecaroline.com/22275/43867-ten-reasons-hate-powerpoint-musings
http://blog.indezine.com/2010/09/powerpoint-sins-conversation-with-simon.html
But wait - there's more . . . . .
Optional - download the latest TRIAL version of Photoshop elements from adobe.com - you will need to have access to this software for the remainder of the semester. It is free for 30 days.

<Log Off>
