![]() 5.7 Eurodollar Futures
5.7 Eurodollar Futures
The International Monetary Market (IMM) a division of the Chicago Mercantile Exchange, trades Eurodollar futures. Other exchanges, including London, Tokyo and Singapore, also trade Eurodollar futures. This makes the market for this contract a virtually continuous market.
The face value for a futures contract is $1,000,000 and it is traded for settlement in March, June, September and December. The contract is defined on the spot 3 month Eurodollar deposit rate. Contrary to T-bill futures, the Eurodollar futures are settled for cash and are the most actively traded short term interest contract. For example, at the close of trading on February 13, 1995 the open interest (i.e., the number of futures contracts currently open) reported by The Wall Street Journal for the March Eurodollar future's contract was 398,971. In contrast, the open interest at this time on the March T-bill futures contract was only 9,524.
As part of this settlement procedure, on the last trading day, the IMM samples twelve dealing banks for the 3 month Eurodollar quotations. After eliminating the top two and the lowest two, the settlement price is computed as an average rate, and convergence is forced between the futures price and the spot price at this time.
Quotations
The Eurodollar future is quoted on an index basis 100 minus the LIBOR on the corresponding Eurodollar contract. The day count for futures contracts is actual days over a 360 day year.
For example, in The Wall Street Journal, April 19,1994, the June Eurodollar futures had a settlement price of 100 - 0.0466 = 95.34 and therefore the settlement yield was 4.66%. One basis point change in this 3 month contract equals $25 ($25 = 0.0001*1,000,000*0.25).
This contract provides investors with an alternative method for locking in a forward rate. Under the assumption that the future's price equals the forward price, the relationship between futures prices and forward Euro prices implied from the current Euroyield curve can be contrasted.
Estimating the LIBOR Yield Curve from Eurodollar Futures
A LIBOR yield curve shows the relationship between LIBOR spot rates for Eurodollars, Euroyen, Eurosterling, and so on, and time to maturity. The spot rates for any maturity can be computed from the set of spots quoted by dealers in the Eurocurrencies.
Euroforward rates are computed using the following general relationship (see Constructing Your Own Yield CurveCYC_TSR):
![]()
This equation allows you to estimate the LIBOR yield curve from the real time trading in the Eurofutures markets for up to 10 years’ time. This allows the implied yield curve for spot rates to be computed from the shortest term spot Eurorate, plus implied forward rates, as required in the left hand side of the above equation.
Recall that from the price and the face value, FV, of a T-bill future you can compute the forward yield to maturity as follows:

Solving for r above, using a 91/365 proportion of a year provides the 3 month forward rate from the time of the future's contract expiration.
The Wall Street Journal reports quotes for the Eurodollar futures for approximately 10 years out. From each quote, an implied annualized forward yield to maturity can be computed.
This set of implied forward rates is substituted into the left hand side of the spot rate equation to solve for the spot rate for maturities up to 10 years:
![]()
LIBOR Yield Curve Example: Monday February 13, 1995
At the close of Monday, February 13, 1995, the one month spot LIBOR rate was 6 1/8%. In Table 5.3, the yield curve is estimated starting with the one month spot LIBOR rate and then computing the remaining spot rates from the Eurodollar futures market. Monthly compounding is assumed and the remaining spot rates are estimated from each 3 month contract as follows:
The March entry:
The Future's contract price = $983,900 = ($1,000,000 - ($1,000,000*0.9356)*0.25) for a $1M face amount;
1.005425 = (1,000,000/983,900)^(1/3);
1.005345 = (1.00510417*1.005425^3)^(1/4)
Annualized, this equals 6.41%.
The June entry:
1.005609 = ((1.005345^4 )*1.005962^3)^(1/7)
Annualized, this equals 6.73%, and so on.
Table 5.3: Futures Contract Spot Rates
|
Futures Contract Date |
Price |
Spot Rate: Months |
Spot Rate |
|
March |
93.56 |
4 |
6.41 |
|
June |
92.93 |
7 |
6.73 |
|
September |
92.51 |
10 |
6.99 |
|
December |
92.18 |
13 |
7.20 |
|
March 96 |
92.14 |
16 |
7.35 |
|
June |
92.08 |
19 |
7.45 |
|
September |
92.09 |
22 |
7.53 |
|
December |
92.06 |
25 |
7.59 |
|
March 97 |
92.12 |
28 |
7.63 |
|
June |
92.12 |
31 |
7.67 |
|
September |
92.12 |
34 |
7.70 |
|
December |
92.07 |
37 |
7.72 |
|
March 98 |
92.12 |
40 |
7.74 |
|
June |
92.09 |
43 |
7.76 |
|
September |
92.07 |
46 |
7.78 |
|
December |
92.01 |
49 |
7.80 |
|
March 99 |
92.05 |
52 |
7.81 |
|
June |
92.03 |
55 |
7.83 |
|
September |
92.01 |
58 |
7.84 |
|
December |
91.95 |
61 |
7.86 |
The estimates from the futures contracts in Table 5.2 compare favorably with the spot LIBOR rates for Monday, February 13, 1995. The spot LIBOR rates were:
1 month: 6 1/8% (6.125%)
3 months: 6 5/16% (6.3125%)
6 months: 6 5/8% (6.625%)
12 months: 7 1/4% (7.25%)
Online, you can cut and paste between a spreadsheet and Bond Tutor. By selecting the Yield Curve and Forward Rates, you can enter the Eurodollar yield curve information. Graphically, the yield curve appears as generally upward sloping, as follows:
The spot rate of the first highlighted rate is provided in the middle text box (0.06415).
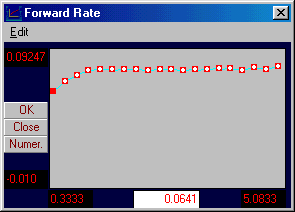
Similarly, the forward rate curve appears as follows:

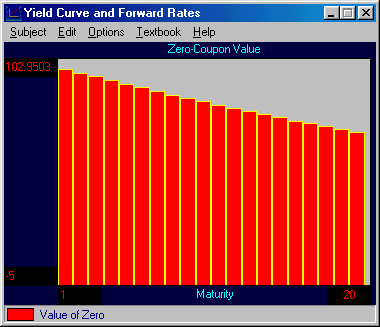
If time deposits were priced from this yield curve, then they would appear as follows:

That is, the value of zero-coupon bonds with a face value equal to $100 range from $97.948 to $68.075 for maturities from 4 months to 61 months. If you were pricing a sequence of $100 cash flows that commence in 4 months time and continue every 3 months thereafter up until 61 months, then the present value using the LIBOR curve would be $1646.08.
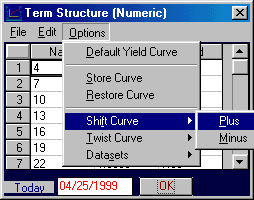
Now, suppose that the spot Eurodollar rates increase sharply. Online, you can see the effects of shifting the LIBOR yield curve upward by selecting the desired amount. Beside Plus or Minus you can select 1, 10, 50 or 100 basis points.

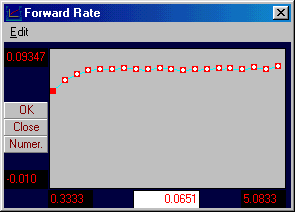
By completing the shift upward by 10 basis points, the perturbed yield curve appears as follows:
Likewise, the implied forward rate curve appears as follows:

The impact of this upon the portfolio of zero-coupon bonds is to decrease the value from thier initial values:
to the perturbed values:

For example, the zero coupon bond that has a remaining life of 1 and 1/3 years shifts from 90.977 to 90.864.
In practice, the Eurocurrency yield curves play an important role in both international and domestic finance. Euromarkets are extremely liquid and relatively unregulated. As a result, they are used to price many different financial contracts in practice, because the synthetic equivalent contract to the contract being priced, or hedged, can be constructed using the Euromarkets.
In Chapter 6 we introduce three different techniques that can be used to hedge fixed-income positions against the risk of yield curve shifts.
previous topic
(C) Copyright 1999, OS Financial Trading System