Add a visualization of the system using arrows
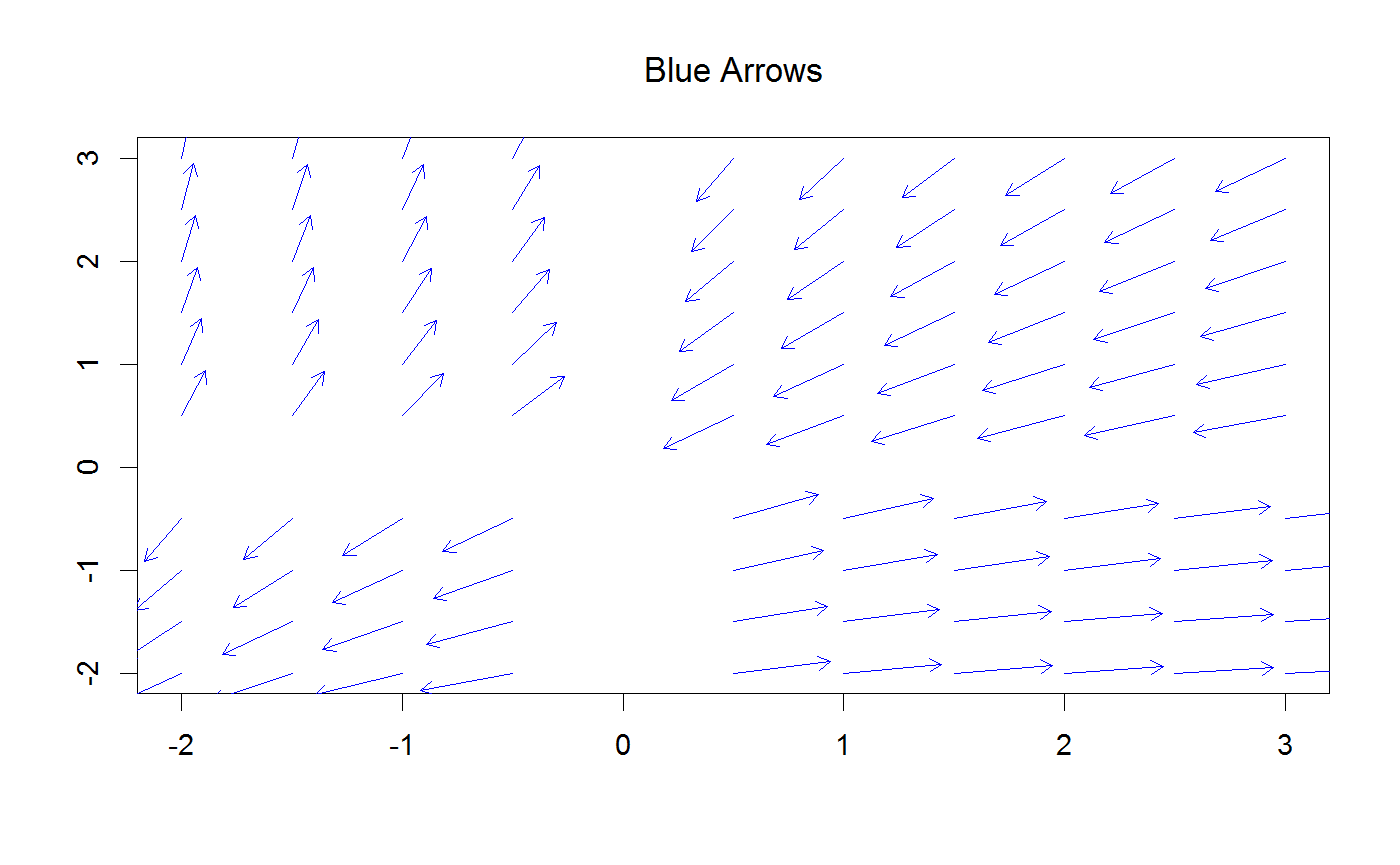
The visualization displays the movement of a uniform array of points under the function defined by the model as arrows. The base of the arrow is placed on each discretized point. The tip of the head of the arrow points in the direction of the image of that point. In order to use this visualization, a discretization parameter must be set either on the range or as a parameter.
dsarrows(scale = 0.9, col = "blue", angle = 30, type = "simple",
  length = NULL, iters = 1, head.length = 0.2, discretize = NULL,
  behind = TRUE, crop = FALSE, ...)
Arguments
| scale | Changes the size of the arrow to a user-specified scale relative to the discretization parameter. |
|---|---|
| col | Colors the arrows. |
| angle | Specifies the angle of the head of the arrow.
Passed directly into |
| type | Determines type of arrow. Accepted values are identical to acceptable values of arr.type in the "shape" library. |
| length | A non-scaled length of arrow tail. Causes |
| iters | Allows user to point the head of each arrow towards the result of a specified number of iterations of the function. |
| head.length | Changes the size of the arrowhead. Passed directly to |
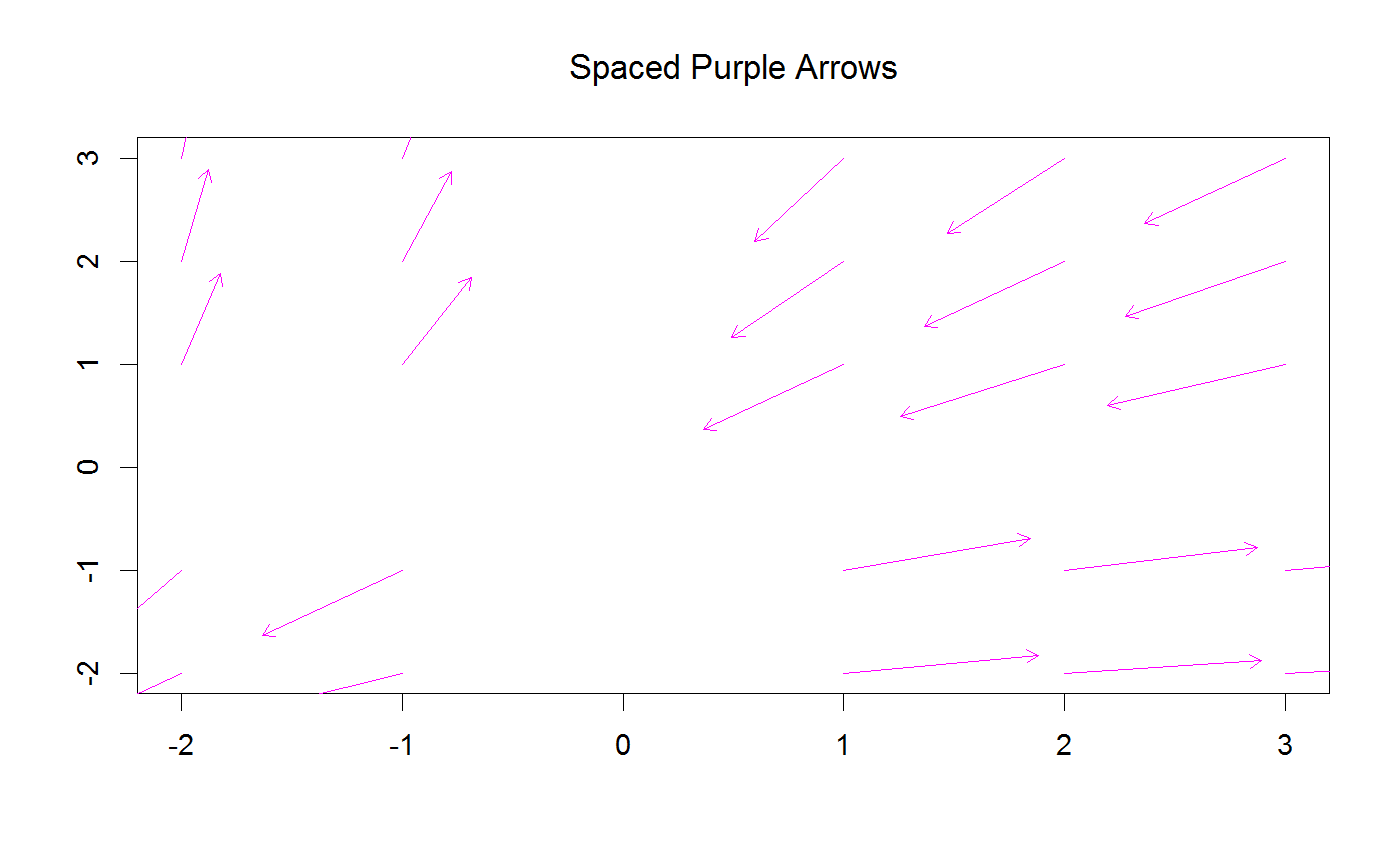
| discretize | Overrides the discretization parameter defined in the range. |
| behind | Forces the arrows to be a background object for the purposes of layering. |
| crop | If |
| ... | Further graphical parameters passed to |
Details
The arrows are scaled according to the discretization. If the discretization is too fine (small), the arrows may seem crowded. It is suggested to try a coarser (larger) discretization size before modifying the size of the arrows.
The most common way to invoke dsarrows is to simply add
model + dsarrows(), where model is a variable corresponding
with the dsmodel class.
See also
Examples
library(dsmodels) fun <- function(X,Y) { list( X/exp(Y), Y/exp(X) ) } model <- dsmodel(fun, title = "Blue Arrows") range <- dsrange(x = -2:3, y = -2:3, discretize = .5) model + range + dsarrows()dsmodel(fun, title = "Spaced Purple Arrows") + dsrange(x = -2:3, y = -2:3, discretize = .5) + dsarrows(discretize = 1, col = "magenta")