Parametric curves or a graph of functions
This function takes a description of a curve and creates an object displaying the curve, and optionally
it's behavior throughout iterations of the system. Functions can be provided as expressions of x,
for graphing curves, or t, for parametric curves.
The curve is defined either by the graph of a single function or a pair of parametric
equations. By default, rendered with the lines function.
dscurve(fun, yfun = NULL, col = "black", image = NULL, lwd = 3,
  n = NULL, iters = 0, crop = TRUE, tstart = 0, tend = 1,
  discretize = FALSE, xlim = NULL, ...)
Arguments
| fun | A function. If |
|---|---|
| yfun | The y-equation of the parameteric equations. See sections describing parametric equations for more info. |
| col | The color of the original curve, as a string. |
| image | A single color as a string, or a vector of colors as a string. See details for more information. |
| lwd | Line width expressed as a double. Only used if |
| n | The number of points that will be calculated.
Defaults to the dsrange's |
| iters | Determines the number of iterations of the function when making a color gradient.
Use |
| crop | If |
| tstart | Only used for parametric curves. The minimum input for both functions. Default 0. |
| tend | Only used for parametric curves. The maximum input for the functions. Default 1. |
| discretize | Set |
| xlim | Only used for the graph of a function. Determines the range of x values for which the function is plotted. Defaults to the x limits of the model's dsrange. |
| ... | Further graphical parameters passed to |
The graph of a function
If the parameter yfun is not provided, then dscurve contains
the curve of points (x,fun(x)). The inputs to fun are n points between the maximum
dsrange's x limits, but can be overwritten with the xlim parameter.
fun can either be any function of a single parameter, or an expression with exactly x as the free variable.
Parametric equations
If the parameter fun and yfun are both provided,
dscurve contains the parametric curve described by the functions. The function is
calculated at n
points ranging from tmin to tmax.
fun and yfun can either be any function of a single parameter, or an expression with exactly t as the free variable.
Images of curves
The dscurve object begins with an initial curve. Images of the curve may be displayed in three ways.
If the image parameter is a single color and iters is not set, then dscurve will calculate and display
the image of the curve under the model's function in that color.
If the image parameter is a vector of k colors, then dscurve calculates and
displays k successive images of the curve using those colors.
The string "NA" may be used to avoid displaying an iteration.
If the image parameter is a single color and iters is defined, then iters
successive images are displayed, using a gradient between col and image.
In most cases, rather than specifying col and image separately, they may be
combined into a single vector.
See also
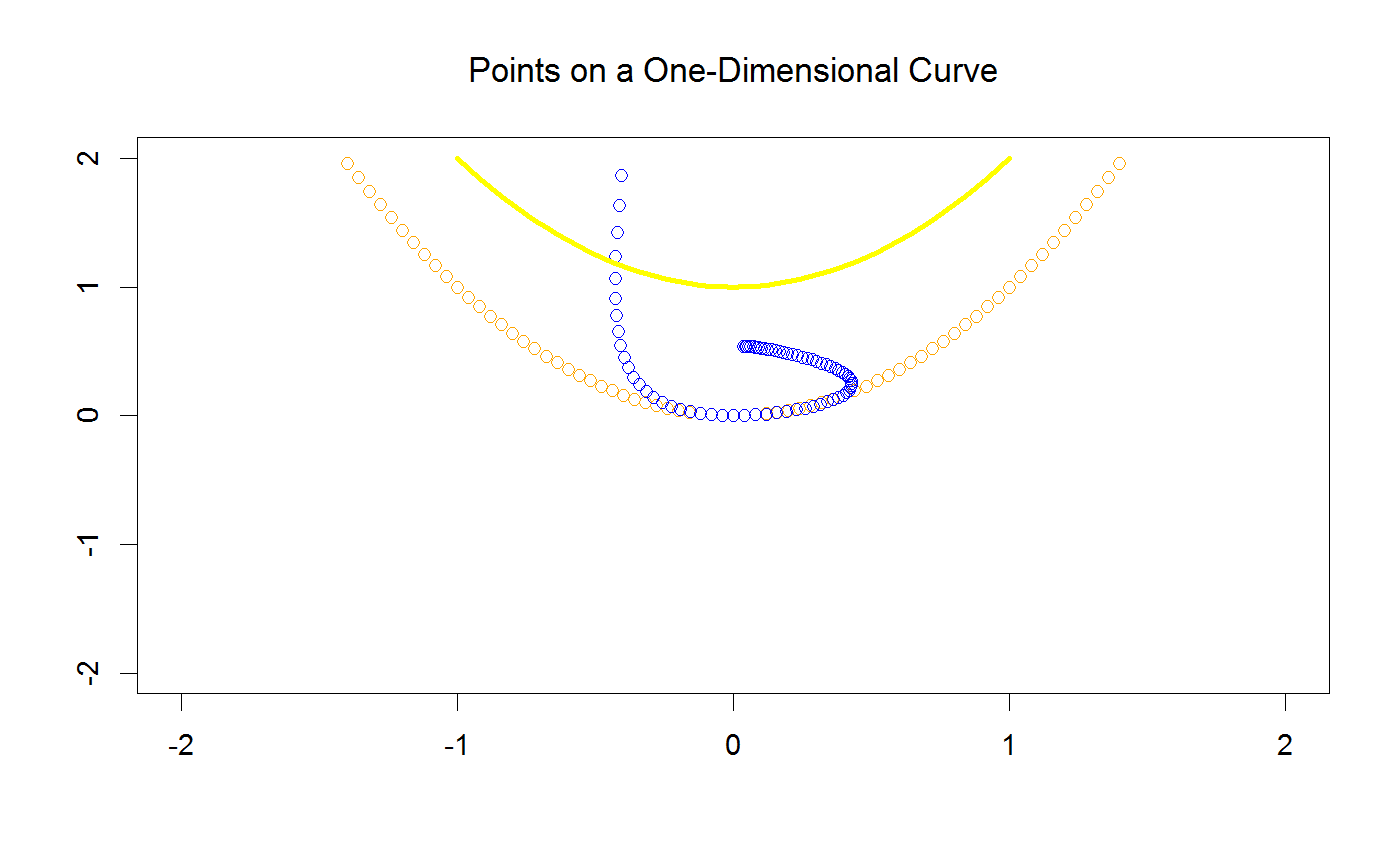
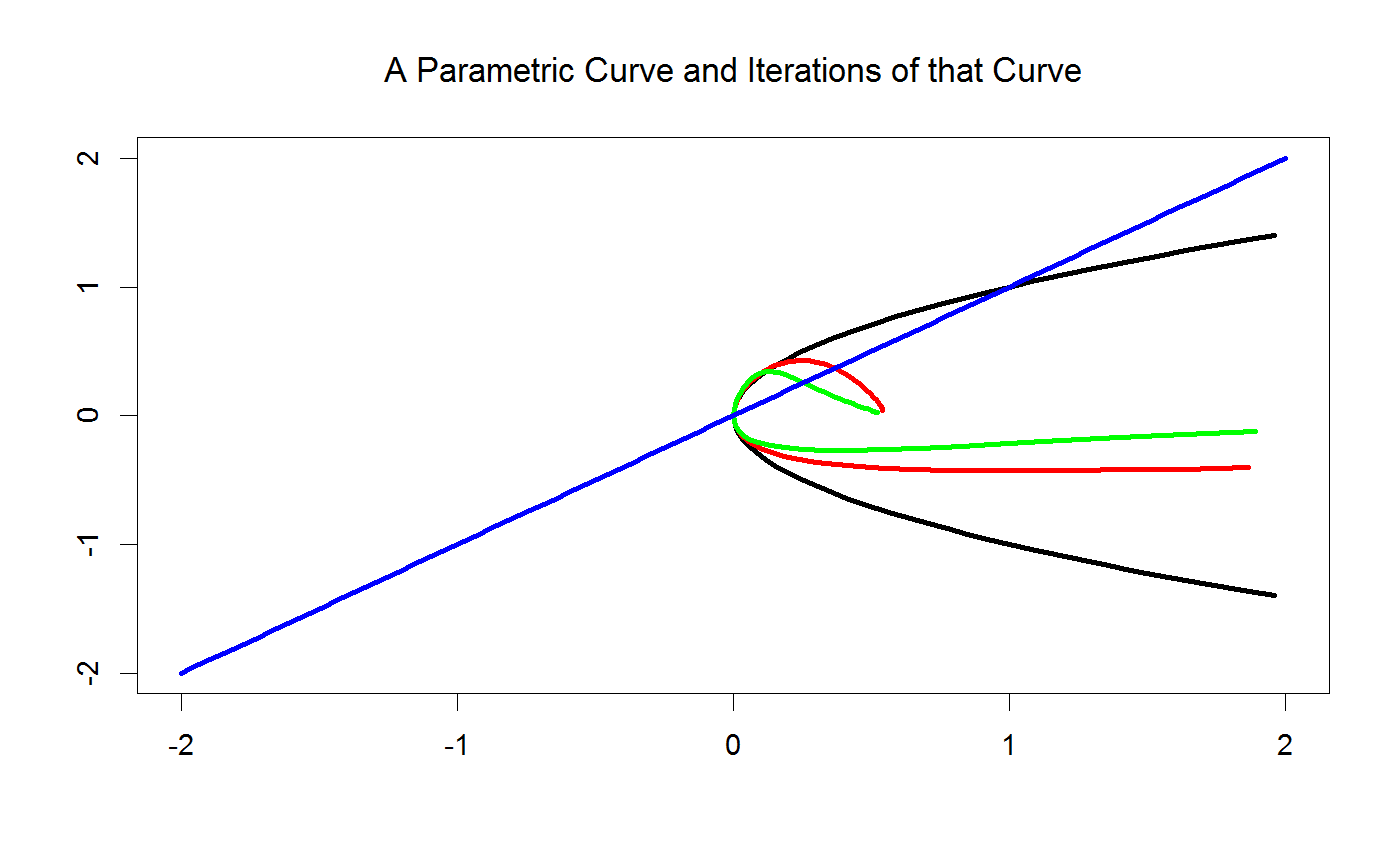
Examples
library(dsmodels) fun <- function(X,Y) { list( X/exp(Y), Y/exp(X) ) } model <- dsmodel(fun, title = "Points on a One-Dimensional Curve") range <- dsrange(-2:2,-2:2, discretize = 0.5) # Add the graph of a function and its image in blue. graphcrv <- dscurve(function(x) x^2, col = "orange", image = "blue", discretize = TRUE, xlim = c(-2,2)) model + range + graphcrv# Add the graph of expression of x. model + dscurve(x^2+1, col="yellow")# Create a parametric curve with image iterations red then green. paramcrv <- dscurve(function(t) t^2, function(t) t, image = c("red", "green"), tstart = -2, tend = 2) dsmodel(fun, "A Parametric Curve and Iterations of that Curve") + dsrange(-2:2, -2:2, discretize = 0.5) + # A parametic curve defined by expressions of t. paramcrv + dscurve(4*t-2,4*t-2,col="blue")