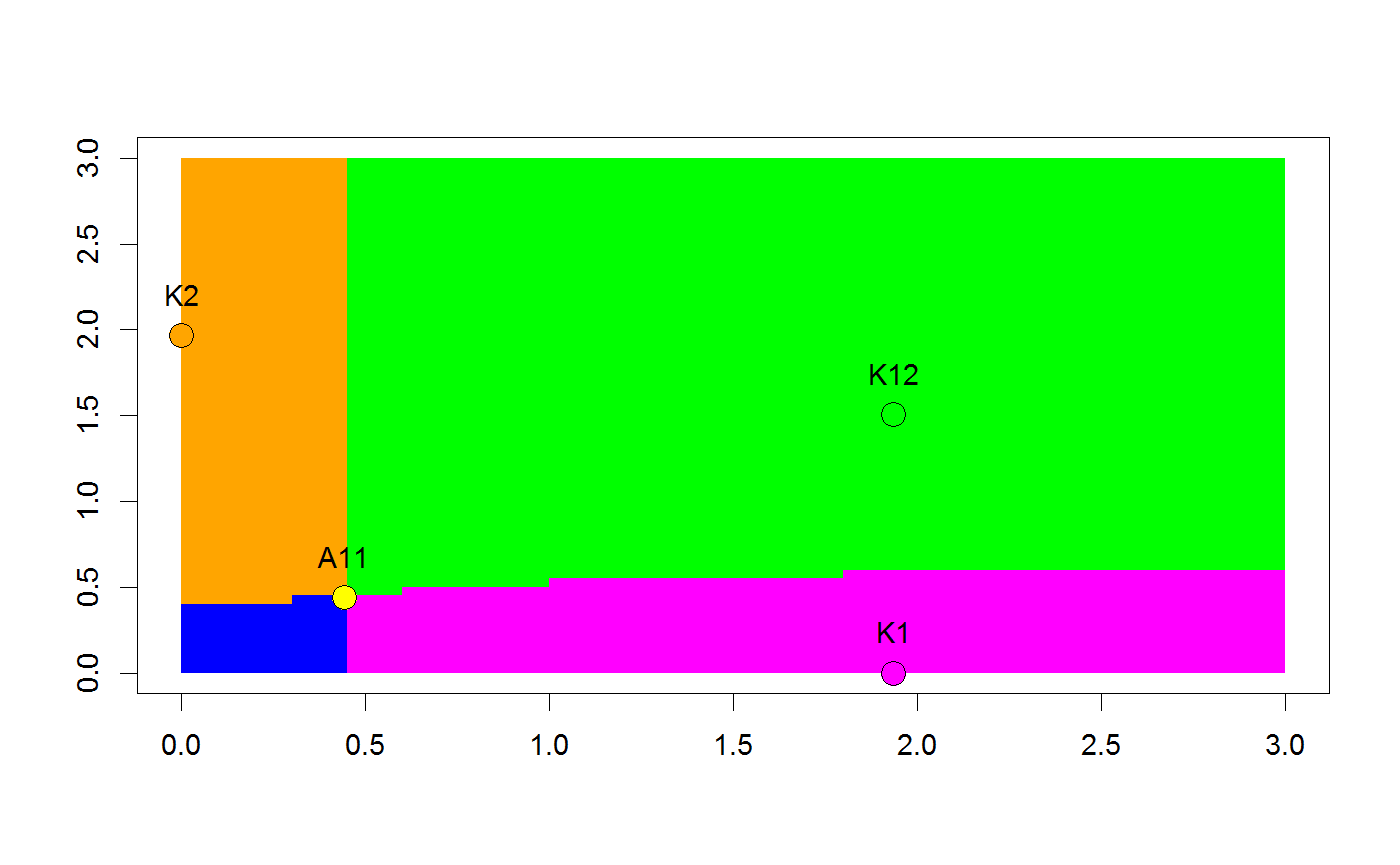
Find basins of attraction by simulation
Attempts to determine which areas of the range are drawn to which attractors by simulation.
The attractors must be added to the model before simbasins() is added. The space
is discretized into squares, and
repeated iteration of the model's function is used to determine which attractor the middle
of each square tends towards. The square is then given the color of that attractor. The model
is assumed to be well behaved in that every point will eventually move within epsilon
of an attractor. There is absolutely no guarantee that all basins will be captured
by this approach, even with a fine-grained discretization. It is possible to blur
boundaries, crop basins, or miss entire regions.
simbasins(discretize = NULL, xlim = NULL, ylim = NULL, iters = NULL,
  epsilon = NULL, behind = TRUE, tolerance = sqrt(.Machine$double.eps),
  stride = 8, cols = NULL, missingCol = "NA", ...)
Arguments
| discretize | The size of each square. If not set, the discretization of the range is used. May be set separately from the discretization of the range without overwriting. |
|---|---|
| xlim | The range of x values to calculate regions over. Defaults to the limits of the range. |
| ylim | The range of y values to calculate regions over. Defaults to the limits of the range. |
| iters | If not set, each point will be iterated indvidually. If set as a number, exactly
that many iterations will be used. If set as |
| epsilon | The distance at which a point is considered to have reached an attractor. Defaults to |
| behind | Forces this item to be a background object for the purposes of layering |
| tolerance | The distance distance at which a point is considered to have stopped moving. Defaults to |
| stride | The number of times the function is applied before movement is checked: in essence finding the basins for |
| cols | The colors to use for the various regions. The colors will be used in the order the attractors were added to the model. |
| missingCol | The color given to points that stop outside of |
| ... | Extra graphical parameters for |
Details
All attractors should be dspoints with the attractor flag set to TRUE,
and should already be composed with the model. Attractors may
have display=FALSE set to avoid displaying the attractor itself. Their color (or region
color, if defined) will be
used as the color of the region. If there are no points with the attractor flag set,
then all points are used as possible attractors. This is not recommended.
If iters is not set, or is set to NULL, then each point will be individually
iterated until within epsilon distance of an attractor, or until it moves less
than tolerance between iterations. Points that stop moving further
than epsilon of an attractor, are colored missingCol, default
"NA".
If iters is given a numeric value, each point is iterated exactly iters times, and tolerance will have no effect.
If the final image is within epsilon of an attractor, then the square is colored appropriately.
If not, then the point is colored missingCol, default "NA".
This will take bounded time, but may give a poorer result.
If iters is given an infinite value, the points are iterated until they move less than
tolerance distance. An attractor is chosen only if it falls within epsilon distance,
otherwise the point is colored missingCol.
The image function is used to display the results.
See also
dspoint
dsregion
dspolygon
simattractors
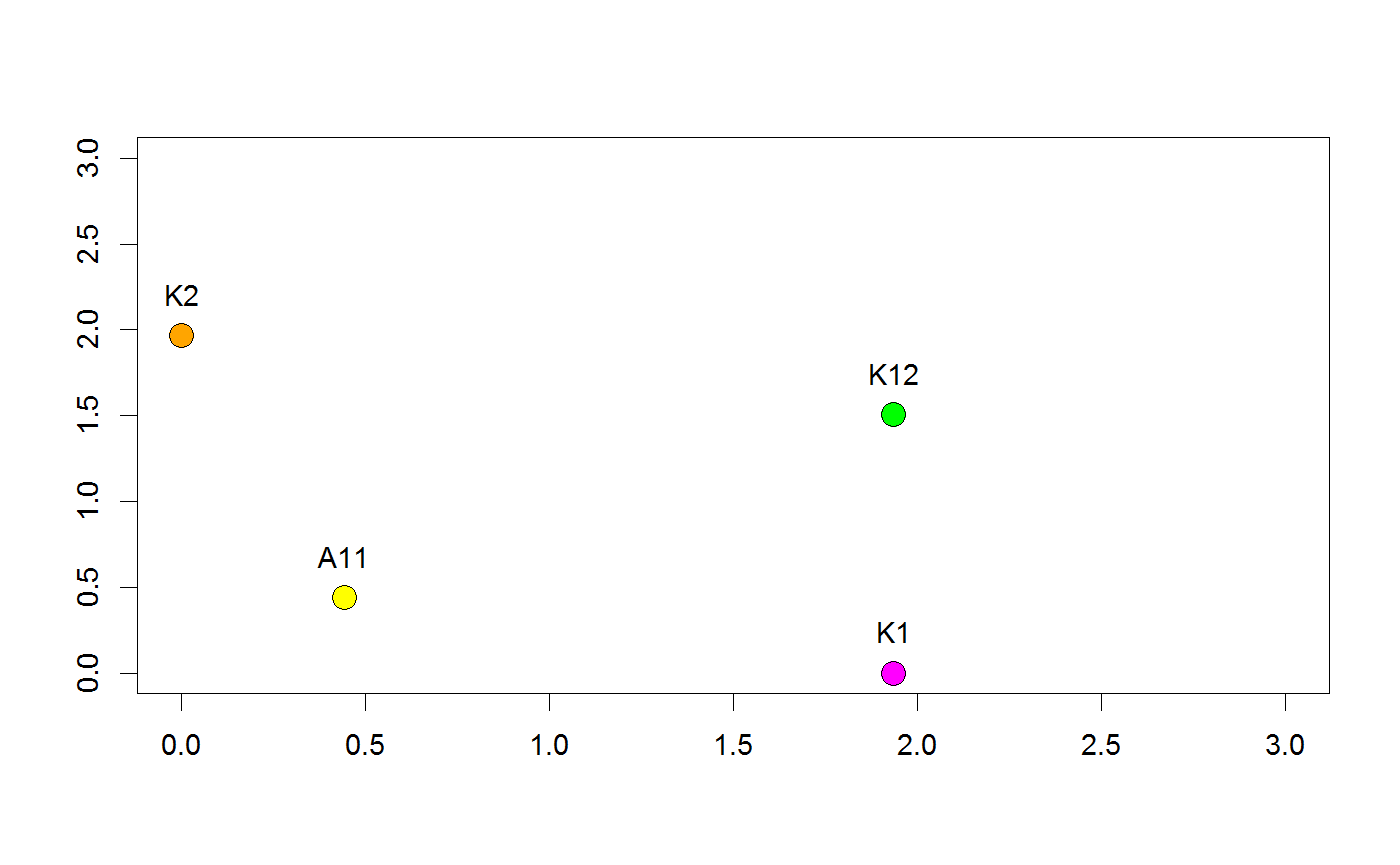
Examples
library(dsmodels)

model <- dsmodel(function(X0,Y0) {
list(X0*exp(2.6-X0-6.45/(1+4.5*X0)),
     Y0*exp(2.6-Y0-0.15*X0-6.25/(1+4.5*Y0)))
})
model+dsrange(0:3,0:3,discretize = .08)+
      dspoint(1.9358, 1.5059, attractor=TRUE, col="green",  label = "K12")+
      dspoint(1.9358, 0,      attractor=TRUE, col="magenta",label = "K1")+
      dspoint(0,      1.9649, attractor=TRUE, col="orange", label = "K2")+
      dspoint(0,      0,      attractor=TRUE, col="blue",   display=FALSE)+
      dspoint(0.4419, 0.4416, col="yellow", label="A11")+
      simbasins(discretize=0.05)