Holiday Inn Case Seeds
Two Ideas for Hotel Replacement Cost Cases in Accounting
Bob Jensen
at
Trinity University
One of the most popular Excel
spreadsheets that Bob Jensen ever provided to his students ---
www.cs.trinity.edu/~rjensen/Excel/wtdcase2a.xls
Advantages
and disadvantages of replacement cost (entry value, current cost) accounting are
discussed in greater detail are listed below.
Advantages
of Entry Value (Current Cost, Replacement Cost) Accounting
·
Conforms
to capital maintenance theory that argues in favor of matching current revenues
with what the current costs are of generating those revenues. For example, if
historical cost depreciation is $100 and current cost depreciation is $120,
current cost theory argues that an excess of $20 may be wrongly classified as
profit and distributed as a dividend. When it comes time to replace the asset,
the firm may have mistakenly eaten its seed corn.
·
If the
accurate replacement cost is known and can be matched with current selling
prices, the problems of finding indices for price level adjustments are avoided.
·
Avoids to
some extent booking the spread between selling price and the wholesale "cost" of
an item. Recording a securities “inventory” or any other inventory at exit
values rather than entry values tends to book unrealized sales profits before
they’re actually earned. There may also be considerably variability in exit
values vis-à-vis replacement costs.
Although I
am not in general a current cost (replacement cost, entry-value) advocate, I
think you and Tom are missing the main theory behind the passage of the now
defunct FAS 33 that leaned toward replacement cost valuation as opposed to exit
valuation.
The best
illustration in favor of replacement cost accounting is the infamous Blue Book
used by automobile and truck dealers that lists composite wholesale trading for
each make and model of vehicle in recent years. The Blue Book illustration is
relevant with respect to business equipment currently in use in a company since
virtually all that equipment is now in the “used” category, although most of it
will not have a complete Blue Book per se.
The theory
of Blue Book pricing in accounting is that each used vehicle is unique to a
point that exit valuation in particular instances is very difficult since no two
used vehicles have the same exit value in a particular instances. But the Blue
Book is a market-composite hundreds of dealer transactions of each make and
model in recent months and years on the wholesale market.
Hence I
don’t have any idea about what my 1999 Jeep Cherokee in particular is worth, and
any exit value estimate of my vehicle is pretty much a wild guess relative to
what it most likely would cost me to replace it with another 1999 Jeep Cherokee
from a random sample selection among 2,000 Jeep dealers across the United
States. I merely have to look up the Blue Book price and then estimate what the
dealer charges as a mark up if I want to replace my 1999 Jeep Cherokee.
Since Blue
Book pricing is based upon actual trades that take place, it’s far more reliable
than exit value sticker prices of vehicles in the sales lots.
Conclusion
It is sometimes the replacement market of actual transactions that makes a Blue
Book composite replacement cost more reliable than an exit value estimate of
what I will pay for a particular car from a particular dealer at retail. Of
course this argument is not as crucial to financial assets and liabilities that
are not as unique as a particular used vehicle. Replacement cost valuation for
accounting becomes more defensible for non-financial assets.
Disadvantages of Entry Value (Current Cost, Replacement Cost) Accounting
·
Discovery
of accurate replacement costs is virtually impossible in times of changing
technologies and newer production alternatives. For example, some companies are
using data processing hardware and software that no longer can be purchased or
would never be purchased even if it was available due to changes in technology.
Some companies are using buildings that may not be necessary as production
becomes more outsourced and sales move to the Internet. It is possible to
replace used assets with used assets rather than new assets. Must current costs
rely only upon prices of new assets?
·
Discovering current costs is prohibitively costly if firms have to repeatedly
find current replacement prices on thousands or millions of items.
·
Accurate
derivation of replacement cost is very difficult for items having high
variations in quality. For example, some ten-year old trucks have much higher
used prices than other used trucks of the same type and vintage. Comparisons
with new trucks is very difficult since new trucks have new features, different
expected economic lives, warranties, financing options, and other differences
that make comparisons extremely complex and tedious. In many cases, items are
bought in basket purchases that cover warranties, insurance, buy-back options,
maintenance agreements, etc. Allocating the "cost" to particular components may
be quite arbitrary.
·
Use of
"sector" price indices as surrogates compounds the price-index problem of
general price-level adjustments. For example, if a "transportation" price index
is used to estimate replacement cost, what constitutes a "transportation" price
index? Are such indices available and are they meaningful for the purpose at
hand? When FAS 33 was rescinded in 1986, one of the major reasons was the error
and confusion of using sector indices as surrogates for actual replacement
costs.
·
Current
costs tend to give rise to recognition of holding gains and losses not yet
realized.
Question
What is the difference between "replacement cost" and "factor replacement cost?"
Answer
It is much like a make versus buy decision. As an illustration, the "replacement
cost" of a computer is the price one would pay for a computer in the market to
replace an existing computer. That presumably includes the mark up profits of
vendors in the supply chain. The "factor replacement cost" excludes such mark up
profits to the extent possible by estimating what it would cost in the
"transformation process" to purchase the components for transformation of those
components into a computer. The "factor replacement cost" adds in labor and
manufacturing overhead. It excludes vendor profits in the computer supply chain
but not necessarily vendor profits in the purchase price of components. It
becomes very complicated in practice, however, because computer vendors do such
things as include warranty costs in the pricing of computers. Assembled
computers in house probably have no such warranties. A more detailed account of
factor replacement costing is provided in Chapters 3 and 4 of Edwards and Bell.
Edgar O. Edwards and Philip W. Bell, The Theory and Measurement of Business
Income (Berkeley: University of California Press, 1961).
Of course
this does not solve the fundamental problem of replacement cost accounting that
arises when there are no current assets or component parts of assets that map
directly into older assets still being used by the company. For example, old
computers and parts for those computers are probably no longer available. Newer
computers have many more enhancements that make them virtually impossible to
compare with older computers such using prices of current computers is a huge
stretch when estimating replacement costs of older computers that, for example,
may not even have had the ability to connect to local networks and the Internet.
Zeff
writes as follows on Page 623:
Edwards and Bell, in their provocative volume, propound a measure called
"business profit," which is predicated on what might be termed "factor
replacement cost." "Business profit" is the sum of (1) the excess of current
revenues over the factor replacement cost of that portion of assets that can be
said to have expired currently, and (2) the enhancement during the current
period of the factor replacement cost.
Advantages
and disadvantages of replacement cost (entry value, current cost) accounting are
discussed in greater detail are listed below.
Advantages
of Entry Value (Current Cost, Replacement Cost) Accounting
·
Conforms
to capital maintenance theory that argues in favor of matching current revenues
with what the current costs are of generating those revenues. For example, if
historical cost depreciation is $100 and current cost depreciation is $120,
current cost theory argues that an excess of $20 may be wrongly classified as
profit and distributed as a dividend. When it comes time to replace the asset,
the firm may have mistakenly eaten its seed corn.
·
If the
accurate replacement cost is known and can be matched with current selling
prices, the problems of finding indices for price level adjustments are avoided.
·
Avoids to
some extent booking the spread between selling price and the wholesale "cost" of
an item. Recording a securities “inventory” or any other inventory at exit
values rather than entry values tends to book unrealized sales profits before
they’re actually earned. There may also be considerably variability in exit
values vis-à-vis replacement costs.
Although I
am not in general a current cost (replacement cost, entry-value) advocate, I
think you and Tom are missing the main theory behind the passage of the now
defunct FAS 33 that leaned toward replacement cost valuation as opposed to exit
valuation.
The best
illustration in favor of replacement cost accounting is the infamous Blue Book
used by automobile and truck dealers that lists composite wholesale trading for
each make and model of vehicle in recent years. The Blue Book illustration is
relevant with respect to business equipment currently in use in a company since
virtually all that equipment is now in the “used” category, although most of it
will not have a complete Blue Book per se.
The theory
of Blue Book pricing in accounting is that each used vehicle is unique to a
point that exit valuation in particular instances is very difficult since no two
used vehicles have the same exit value in a particular instances. But the Blue
Book is a market-composite hundreds of dealer transactions of each make and
model in recent months and years on the wholesale market.
Hence I
don’t have any idea about what my 1999 Jeep Cherokee in particular is worth, and
any exit value estimate of my vehicle is pretty much a wild guess relative to
what it most likely would cost me to replace it with another 1999 Jeep Cherokee
from a random sample selection among 2,000 Jeep dealers across the United
States. I merely have to look up the Blue Book price and then estimate what the
dealer charges as a mark up if I want to replace my 1999 Jeep Cherokee.
Since Blue
Book pricing is based upon actual trades that take place, it’s far more reliable
than exit value sticker prices of vehicles in the sales lots.
Conclusion
It is sometimes the replacement market of actual transactions that makes a Blue
Book composite replacement cost more reliable than an exit value estimate of
what I will pay for a particular car from a particular dealer at retail. Of
course this argument is not as crucial to financial assets and liabilities that
are not as unique as a particular used vehicle. Replacement cost valuation for
accounting becomes more defensible for non-financial assets.
The Holiday Inn Case Seeds
Hi Tom,
My recent stay in the Concord Holiday Inn and your replies prompted me to write
an online document called
"Holiday Inn Case Seeds and Questions About Tobin's Q"
Two Ideas for Hotel Replacement Cost Cases in Accounting"
http://www.cs.trinity.edu/~rjensen/temp/HolidayInnCaseSeeds.htm
If you are willing to counter my arguments, I would really like to see
why investors and creditors would be interested in the 2011 Replacement Cost
financial statements for the Concord, NH and Brookline, MA Holiday Inn hotels.
To me it seems that such statements would be more misleading than historical
cost financial statements given the fact that neither historical costs nor
replacement costs are valuation-based financial statements.
Thanks,
Bob
Tom Selling and I have been having a bit of a go around recently
(actually dating back several years) over the benefits of replacement cost
accounting as a substitute of historical cost accounting of operating assets
(land, buildings, machinery, vehicles, etc.).
I have two starting modules on this topic at the following
links:
http://www.trinity.edu/rjensen/Theory02.htm#FairValue (in particular
scroll down to Days Inn and U.S. Steel)
http://www.trinity.edu/rjensen/Theory02.htm#BasesAccounting
Tom has two starting modules on this topic at the following
links:
Click Here and Scroll Down
http://accountingonion.typepad.com/theaccountingonion/2011/12/im-for-auditor-term-limits-but.html
or
Click Here
http://accountingonion.typepad.com/theaccountingonion/2012/01/its-nice-to-win-something-even-if-its-the-losing-cause-man-of-the-year.html
There are three basic issues. One is whether replacement costs
should literally replace historical cost (traditional) accounting of most
operating assets in single-column financial statements. The second issue is
whether replacement cost financial statements should be required as
supplementary financial statements as they were under FAS 33 before it was
rescinded. The third issue and related issue is whether benefits versus costs of
generating verifiable replacement cost numbers are such that the benefits are
deemed much greater or lower than the cost.
The first thing to note is that replacement cost accounting is
not valuation accounting. The current book value of a building after 40 years of
straight line depreciation may be $10 million. The replacement cost may be $120
million today, but the replacement cost book value my only be $40 million after
depreciating the current replacement cost. The exit value of the old building
today be negative since buyers of the site and building only want the land and
would tear down the old building.
The second thing to note is that the cost of generating
verifiable replacement cost numbers for operating assets can be very costly. One
reason is that many of the most expensive assets like factory buildings,
warehouses, stores, hotels, etc. are highly unique. Whereas it's quite easy to
derive the verifiable current replacement cost 500 shares of IBM common shares
because these shares are fungible items, the cost of generating verifiable
replacement cost numbers for each of 500 Holiday Inn hotels is very expensive
since each one varies in location, size, and local construction codes and costs
such as the difference between construction codes and labor costs in Manhattan
versus a hurricane alley in Biloxi.
Today on Friday the 13th (January 13, 2012) Erika and I returned
from staying one night in the Holiday Inn in downtown Concord, NH. and a second
night in the relatively new Marriott Courtyard in Concord.
It dawned on me that it might be informative if some
accounting researcher (not me) wrote a case about two old and rather shabby
Holiday Inn hotels where I've stayed at recently. One might might be described
shabby and possibly uncomfortable. The other might be described as really shabby
and most likely very uncomfortable. I say this noting that I am a Holiday Inn
Priority Club loyalist and frequently seek out Holiday Inn hotels, because they
are usually be best value for the money in terms of location and price. Quality
is variable among Holiday Inns, and location often trumps both price and quality
in some instances, especially the shabby Brookline Holiday Inn that we stay in
frequently that's close to the Harvard Medical School where Erika has repeated
medical services from her wonderful nearby spine surgeon.
Before I describe these two shabby Holiday Inn hotels, I suggest
that these would make wonderful cases for studying how replacement cost
accounting alone can be very misleading. Hence I will concentrate on the
benefits (positive and negative) of replacement cost accounting apart from the
cost of generating verifiable replacement cost data (which would entail input
from (often flakey) real estate appraisers and architects) in the case of
hotels.
Historical Cost Hypothetical Data for the past
year (2011)
Consider first the Holiday Inn in Concord, NH. Based upon my hypothetical data,
the book values 2011 daily revenues and book values are as follows:
$150 plus free parking per night per room average after factoring in an 80%
occupancy rate in 2011
$60 per night net positive cash flow after deducting all cash costs for labor,
utilities, taxes, and daily maintenance of all occupied rooms
$50 per night historical accrual net profit after deducting for room
depreciation (for infrequent new carpets, curtains, paint, mattresses, and
furnishings including TV sets). Since the rooms in this hotel are shabby and
most of the window air conditioners will not allow for varying temperature
settings, I conclude that the rooms are upgraded very, very infrequently in this
particular old hotel).
$50 per night net profit after deducting for building depreciation since this
old building is most likely fully depreciated but still in solid condition.
Replacement Cost Hypothetical Replacement Cost
Data for the past year (2011)
$150 plus free parking per night on average after factoring in an 80% occupancy
rate in 2011
$60 per night net positive cash flow after deducting all cash costs for labor,
utilities, taxes, and daily maintenance of all occupied rooms
$60 per night accrual net profit after deducting for room replacement cost
depreciation (for infrequent new carpets, curtains, paint, mattresses, and
furnishings including TV sets). Since the rooms in this hotel are shabby and
most of the window air conditioners will not allow for varying temperature
settings, I conclude that the rooms are upgraded very, very infrequently in this
particular old hotel).
-$100 per night negative profit per room after deducting building replacement
cost depreciation
Of course the hotel's building was actually replaced, we would
expect room rates to be increased. But since Tom is talking about replacement
costs of historical revenues, it would be pure fiction to adjust replacement
cost financial statements for past earned revenues.
Especially note that 2011 replacement cost financial statements
are not very good estimates of future financial statements since many things
would change if the Concord, NH Holiday Inn building was actually replaced.
Firstly, the 2011 room pricing would most likely be increased as much as
possible to recover the replacement costs and still earn a profit. Secondly,
there would be many innovations such solar panels or other more efficient
attributes of modern building operation and maintenance. In Concord, NH property
taxes would jump enormously for a new building since Concord has the highest
property tax rates in New Hampshire.
It is also uncertain what Tom means by "replacement." In the
case of the Holiday Inn in Concord, NH there are two viable and highly different
"replacement" alternatives. One replacement alternative would be to virtually
gut the lobby, restaurant, and all the rooms but replace everything within the
old building. The other replacement alternative would be to tear down the old
building and replace it with a new and much different building.
What replacement alternative did you
have in mind Tom if you were to generate Year 2011 replacement cost financial
statements for this old Concord, NH Holiday Inn? Should replacement costs be
based upon a gutted old building or an entirely new building?
Now when it comes to the Holiday Inn in Brookline, MA gutting
the old building and putting new rooms in the old building is probably not a
viable option that should be considered. The reason is that this old hotel
building is so poorly designed and wastes so much space that the only viable
replacement alternative would be to build a new building.
My Major Point
My major point is that replacement cost financial statements of the Holiday Inns
in Brookline, MA and Concord, NH are probably more misleading than helpful
if they are not accompanied by general price-level adjusted historical cost
financial statements over the years 2000-2020. The reason is that by Year 2000
the buildings most likely were fully depreciated without any intent to
replace them during those years or in the next decade or more. Replacement
cost adjustments are pure fantasy and probably more misleading than beneficial
until replacement itself is on the table..
The same reasoning applies to aging rooms of Holiday Inns that
are in major airport hotels. Passengers seeking short stays in airport hotels
are most likely not willing to pay $100 more per night for a glitzy room in a
Airport Holiday Inn if the Airport Days Inn hotel across the street is a better
buy for the money and has identical airport shuttle services.
These old buildings with convenient locations are tremendous
cash cows for Holiday Inn or other owners and probably turned out to be better
investments per room than most any other newer Holiday Inn hotels. The reason is
location, location, and location when coupled with price elasticity of room
rates in these particular locations. Each of these Concord, Brookline, and
airport hotels serves a unique type of customer that will not pay $100 more per
night to stay in a nicer room or eat in a nicer restaurant in these particular
locations. The story might well be different for Holiday Inns in downtown
Manhattan, Miami, and San Francisco where customers might willingly pay $100
more per night for a more glitzy room with a view. But who cares about glitz and
the view in downtown Concord or Brookline?
If some case writer is willing to take up my challenge to write
up a case about the Concord, NH Holiday Inn, here are some facts of possible
interest.
1. This Concord Holiday Inn is in a relatively old by solid
building with location, location, location. It's a block from I-93 ramps. It's
on the end of the main downtown street in Concord (downtown is only about four
blocks long). Most importantly it's only a few short blocks from the gold-domed
NH State Capitol building and surrounding state offices and courtrooms.
2. Concord is a very small city/town with relatively poor taxi
service, especially in rush hours. Parking is very tight around the State
Capitol, so there's a huge monopoly advantage of location for the nearby
walking-distant Holiday Inn. Anybody doing business in the State Capitol area
will soon discover this main advantage of the nearby Holiday Inn is that has no
other walking-distance competition If this same Holiday Inn building was
located two miles away it might only be able to charge half as much for its old
shabby rooms. Replacement may then be on the table.
3. One of the huge discomforts of the Concord Holiday Inn is the
window air conditioning. When we checked in to Room 205 in this Concord Holiday
Inn three days ago the air conditioner did not work at all. When we
were moved to Room 206 the air conditioner would only put out a trickle of heat
not suited to the 20F temperature outdoors and a brewing blizzard. When we were
next moved to Room 210 where we had heat for the night but the window air
conditioner only worked on high and was not controllable with a thermostat. So
every two hours during the night I turned the heat on and off so as not to cook
or freeze during the entire night. Since we were not in this hotel for business
at the State Capitol, we moved out to another hotel the next day. Location was
not so important to us, and Holiday Inn really disappointed us in Concord, NH.
Fortunately when we checked in at noon there were some other vacant rooms to try
out for heat. I don't know how the guests managed if they checked in late in the
day and were assigned to rooms with poor heaters.
4. The carpets were so grimy in each of those rooms that we did
not even want our socks to touch the floor.
5. The curtains were so dirty that if you slapped at them you
could literally see the dust fly.
6. Around the bath tub the caulking looked like frayed, cracked,
and mildewed hemp rope.
7. But this hotel was fully occupied as it is on most nights. I
don't think the hotel cared when we checked out a day early. There were people
in line waiting eagerly for our old shabby room. They most likely had business
in downtown Concord or in the State Capitol area.
8. If I had millions of dollars and wanted to buy a profitable
cash cow hotel, I would probably first consider the old Concord Holiday Inn even
if the 2011 replacement cost financial statements made it look like a horrible
investment.
If some case writer is willing to take up my challenge to write
up a case about the Brookline Holiday Inn, here are some facts of possible
interest. For all practical purposes Brookline is a nice area of Boston, and
there really is no way of knowing when you drive from Boston into Brookline.
1. This Brookline Holiday Inn is in a relatively old and weird
building with location, location, location. It's within walking distance of some
of the restaurants and shops, but this is not a noted part of Boston for
tourists But more importantly, the Brookline Holiday Inn is undoubtedly the main
hotel serving the nearby Harvard University Medical Center and ten or more major
hospitals, medical service centers, and offices of hundreds of the best
physicians in the United States.
One of the most disappointing things to Erika and me about this
HUMC (Longwood) area is the shortage of hotels. I cannot imagine why other hotel
chains do not build in this medical center area to serve this enormous medical
complex --- except for one possible reason that the Brookline Holiday Inn has
300 reasonably-priced rooms (relative to many Boston-area hotel prices).
2. Boston is a huge city with great taxi service, but the
streets are poorly laid out and traffic jams caused by perpetual street
construction are legendary. Hence, there are serious drawbacks of not staying in
either the Brookline Marriott Courtyard or Holiday Inn in Brookline. The
Marriott Courtyard is a newer glitzy hotel that charges about $130 more per
night with no medical discounts plus $30 for basement parking. The Holiday Inn
has medical discounts plus parking is only $15 per night in the basement. With a
medical discount the room rates are currently around $150 per night (slightly
more in the so-called "tower").
3. I suspect that by now the 300-room Brookline Holiday Inn is
fully depreciated for accounting purposes. It's a weird building today. Around
1950 it was a huge and traditional Holiday Inn Motel that was two stories in a
rectangular shape with an inner outdoor courtyard for a pool and lounge area.
The far end of the motel was nearly a block from the lobby. Then perhaps 50 or
more years ago, a small tower was built over the lobby attached to a brick and
glass shell that now surrounds the old motel. The tower has six stories and
central heating/cooling, but it's so small that it only has one elevator. The
huge "atrium" part of this Holiday Inn is really just the old motel with its
hundreds of clanking (now "indoor") window air conditioners and the old swimming
pool (now inside the big shell.)
4. The carpets are so grimy in each of those rooms that we do
not even want our socks to touch the floor.
5. The curtains are so dirty that if you slap at them you can
literally see the dust fly.
6. Around the bath tub the caulking looks like frayed, cracked,
and mildewed hemp rope.
7. But this hotel is 80% occupied on most nights and fully
occupied on event nights in the Boston area such as Red Sox games and nearby
Boston University graduations and alumni events. The steady customers come in
two varieties. Some are "doing business" with the many nearby hospitals and the
Harvard University Medical Center itself. For example, it's very common to ride
the shuttle van to the hospitals with medical school graduates from all over the
world who are now seeking residency training in this area. The second variety of
Holiday Inn guests are old folks like us with appointments in the hospitals and
many offices of physicians in the area.
8. If I had millions of dollars and wanted to buy a profitable
cash cow hotel, I would probably consider the old Brookline Holiday Inn even if
the 2011 replacement cost financial statements made it look like a horrible
investment.
9. If a hotel chain like Hilton or Sheraton built a towering
hotel in Brookline, the room prices would probably have to be so high that the
Brookline Holiday Inn with its 300 rooms would still thrive because of lower
prices. Guests just do not come to Brookline for the Boston Pops, theatres,
skiing, conventions, or the ocean beaches. The bigger and better hotels are
located closer to downtown Boston.
What I really would like to see is for a diligent case
researcher to dig out the true financial and marketing data for both the Concord
and Brookline Holiday Inn hotels. Case writers usually are skillful about
disguising true hotel names and locations if the owners do not want to be
associated with the case writeups. The Brookline Holiday Inn actually is not
owned by Holiday Inn even though it is a Holiday Inn. About two years ago it was
purchased by new owners who spent quite a lot of money on the lobby area and
putting new carpets in the hallways. Not much has changed in the rooms as far as
I can tell.
The new owners have not yet been able to make the restaurant
pay. It is huge and closed every noon and night. Guests can eat hamburgers and
finger foods in the bar, but the bar is never busy since old folks going to
hospitals are not good bar customers. These folks are most apt to eat in the
excellent hospital cafeterias before returning to their hotel. The bar has one
bartender and no table servers other than the bar tender.
I don't know anything about the Concord Holiday Inn ownership.
If I were CEO of Holiday Inn I would want the particular Holiday
Inns in Concord and Brookline upgraded to at least what one expects in the way
of cleanliness, appearance, and air conditioning in any Holiday Inn hotel.
But I would not expect much since these hotels are cash cows without having to
invest a whole lot more in plant.
My Main Concluding Point
My major point is that replacement cost financial statements of the Holiday Inns
in Brookline, MA and Concord, NH are probably more misleading than helpful if
they are not accompanied by general price-level adjusted historical cost
financial statements over the years 2000-2020. Replacement cost accounting
statements would've made the 2011 financial performances of these hotels look
too gloomy. The main reason is that thus far in the 21st Century the
buildings most likely are fully depreciated without any intent to replace them
in decades to come. Replacement cost adjustments are pure fantasy and probably
more misleading than beneficial until replacement itself is on the table. Why
should replacement be on the table since these fully depreciated buildings
remain such huge cash cows in markets that are very price elastic?
These old buildings with convenient locations are tremendous
cash cows for Holiday Inn owners and probably turned out to be better
investments per room than most any other newer Holiday Inn hotels. The reason is
location, location, and location when coupled with price elasticity of room
rates in these particular locations. Each of these Concord, Brookline, and
airport hotels serves a unique type of customer that will not pay $100 more per
night to stay in a nicer room or eat in a nicer restaurant in these particular
locations. The story might well be different for Holiday Inns in downtown
Manhattan, Miami, and San Francisco where customers might willingly pay $100
more per night for a more glitzy room with a view. But who cares about glitz and
the view in downtown Concord or Brookline?
The aging Holiday Inn hotels in Concord, NH and Brookline, MA
have not been replaced in the 21st century and most likely will not be replaced
tor 20 or more years even though rooms will be refurbished on some cycle like
every 10 years. Rates will remain relatively high for these old hotel rooms and
yearly occupancy will remain high. However, the rates are not so high as to
attract bigger and more expensive hotels to be built on nearby sites. This is in
large part due to the price competition of these older Holiday Inns that will
attract a particular type of clientele that is more price conscious than
vacationers in Manhattan, Biloxi, or San Francisco.
Replacement Cost accounting may be more suited to a Holiday Inn
on Miami Beach than it is for downtown Concord, NH or Brookline, MA.
January 14, 2012 reply from Tom Selling
Bob,
I am actually in the middle of writing a replacement cost-themed blog post,
which I hope to have completed by Monday at the latest. I think this will
answer some of your questions. As to the question of how replacement cost
numbers would be used by investors, I do have three quick responses:
·
Replacement costs are an input to the calculation of Tobin’s Q, which is a
tool used by financial analysts – even though the accounting data available
is a very unreliable surrogate for replacement costs.
·
Replacement costs measure the amount of wealth invested in assets, and form
the foundation for determining what an adequate return on investment should
be. With historic cost accounting, one doesn’t have a clue as to the amount
of wealth invested for which a return is to be expected.
·
This is undeveloped at this point, but I may soon be writing a blog post on
replacement costs and LBOs. The motivation is in large part due to the
criticisms (justified or not) of how Romney made his fortune. When Mitt
Romney is being criticized for being a “vulture”, the public doesn’t realize
that at least part of the motivation for an LBO transaction in which the
company is taken private is the available accounting treatment. One
important factor is that the acquirer may be able to avoid recording a new
basis for the assets “acquired” in the LBO. As a result, the going public
prospectus will understate depreciation and show inflated measures of
profitability and ROA. Assuming for the moment that this was the only basis
for the transaction, then LBO activity is obviously inefficient to society
as a whole – even though Bain Capital may have generated a high return for
itself by “churning” the company – and wreaking havoc in the process.
Again, this is an undeveloped point.
Finally, I will give you an example similar to your hotels, but more
personal and one that my wife and I was just talking about today. We have a
condo in Hanover NH that we rent to Dartmouth students. It has been rented
100% of the time, and we increase the rent each year like clockwork. In
short, it’s a cash cow. I purchased it 25 years ago, so its book value is
close to zero. Also, because of its age and some other unique factors we
couldn’t sell it for anywhere near the present value of the future expected
cash flows – even though I might like to sell it at this point in our lives.
How would I measure this condo on our personal balance sheet? I would say
that the most appropriate way would be to determine how much it would cost
me to replace the expected future cash flows. But, I AGREE WITH YOU that
this would be very subjective and perhaps even costly to undertake. As an
accounting policy, in such a case, I believe the utility of the condo might
be reasonably (although pretty conservatively) measured by the amount we
could sell it for. Although not identical, this is pretty consistent with
the “ceiling” limitation on the ARB 43 “market” measurement for inventories,
which has stood the test of time (60 years, maybe) better than any other
accounting standard I can think of.
In the case of your hotels, I would add that there are plenty of brokers
that list all sorts of run down properties similar to the hotels you stayed
at. Location may be important to you, but to investors, it’s the cash flows
that really count. I suppose that location may be unique for some small set
of assets that are highly integrated with other assets, but that’s more a
question of the unit of account – which is a problem no matter which basis
of measurement one uses.
By the way, Bob, I’m writing this from your old stomping grounds – San
Antonio. We’re here to watch our son play basketball for Trinity U – and
I’ll be meeting Walter Schuetze for lunch tomorrow.
January 14, 2012 reply from Bob Jensen
Hi Tom,
The real problem is that 2011 replacement costs financial statements are
mixing 2011 realized revenues with future replacement investments that,
among other things, will have future incremental revenues not factored into
realized 2011 revenues. These are not 2011 proforma statements using
forecast revenues from replacement assets. These are 2011 realized revenues
generated from the old operating assets.
You're still missing my point about replacement cost 2011 financial
statements for the Concord Holiday Inn. Mixing 2011 earned revenues with the
depreciated cost of a new hotel that's not even being contemplated seems to
me to be a bad case of mixing realized revenues with a totally fictional
building investment.
I just don't see how 2011 replacement cost financial statements would be
be of great interest to investors in shares of this hotel's ownership. The
investors might be interested in pro forma statements based upon future cash
flow streams for various alternative new hotel replacements, but this is not
the same as 2011 replacement cost financial statements on the old hotel
building.
As far as Tobin's Q goes for Holiday Inns, it would be interesting to see
if analysts have ever tried to use this ratio for evaluating past
performance of hotels. My guess is that it would be very hard to find a
hotel investment analyst who puts much stock in Tobin's Q. Hotel analysts
will look to past traditional financial statements of a hotel to see how
well management of that hotel managed past invested capital and will
estimate future cash flow streams under various configurations of new
investments, new management, and shifts in market conditions (such as new
hotel construction by competitors in the vicinity).
But I am impressed that you are indeed attempting to show both me and
hotel investment analysts how they've been missing the boat by not using
Tobin's Q. There might be great consulting opportunities for you here if you
can show them how Tobin's Q can benefit them more than the traditional ways
they evaluate past performance of a hotel and future prospects for that
hotel if it is replaced.
The real problem as I see it is that future replacement costs need to be
matched with estimated future revenues. That makes sense, but matching past
revenues with future investments makes little sense and is limited to the
extent that past revenues are predictive of future revenues. In the case of
hotel replacement, however, hotel pricing is likely to change in order cover
new invested money.
My Major Point A new hotel might also attract new types revenues. For
example, neither the Concord Holiday Inn nor Brookline Holiday Inn hotel
makes much money from their lousy and tiny meeting rooms. Replacement hotels
might contain better meeting rooms that attract mini-conferences and local
events. This reinforces my contention that future replacements need to be
matched with future revenues rather than past realized revenues. This could
complicate Tobin's Q analysis since current revenues in the numerator do not
contain incremental new meeting room revenues of the future if the
replacements are actually made in the future.
But I'm really looking forward to a Tobin Q analysis of the Holiday Inns
in Concord and Brookline where there seems to be little incentive to replace
highly successful older hotels rolling in the cash.
One possible research project might be to interview and or survey
financial analysts in general to see why and how they use in Tobin's Q. You
may be assuming too much about the value of Tobin's Q in portfolio decision
making.
One added note Tom.
An alternative definition of Tobin's Q is as follows:
Definition of 'Q Ratio (Tobin's Q Ratio)'
A ratio devised by James Tobin of Yale University,
Nobel laureate in economics, who hypothesized that the combined market
value of all the companies on
the
stock
market should be about equal to their
replacement costs. The Q ratio is calculated as the market value of
a company divided by the replacement value of the firm's assets:
To me this is a very troublesome definition. Besides the usual problems
of measuring the value of the firm (the numerator) in practice, there's the
issue of that that value is affected by virtually everything in the world
concerning a firm, including such factors as changes in competition, changes
in the supply chain, changes in national and world events, etc.
And the there's the intractable problem of computing the replacement cost
of the "firm's assets" in the denominator. One huge stumbling block is that
accountants usually partition "assets" into those that are booked versus
those that are unbooked in the ledger. Unbooked assets include many
intangibles such as the value of the firm's human resources, the value of
its trademarks and reputation, and on and on and on. How do we compute the
replacement value of the human resources and reputation of Apple
Corporation?
Certainly scholars in the accounting academy who have written about
replacement cost accounting never envisioned the components of Tobin's Q.
Virtually all those scholars limited the scope of replacement cost
accounting to converting booked historical cost (or possibly exit values) of
booked assets into replacement costs. Thus, previous replacement cost
accounting scholars really have not, to my knowledge, written anything
practical about adding the other components to Tobin's Q.
I suggest that you, Tom, confine your analysis of replacement cost
accounting to only comparisons of traditional versus replacement cost
financial statements containing only items booked in the ledger. I is
entirely impractical to suggest deriving replacement costs of all of a
firm's unbooked assets.
Thanks,
Bob
January 17, 2012 Update
Tom Selling has what I consider to be a much more reasonable posting on
replacement costing:
"What I Mean by "Replacement Cost" is not Literally Replacement Cost," by
Tom Selling, The Accounting Onion, January 17, 2012 ---
Click Here
http://accountingonion.typepad.com/theaccountingonion/2012/01/what-i-mean-by-replacement-cost-is-not-literally-replacement-cost.html?utm_source=feedburner&utm_medium=feed&utm_campaign=Feed%3A+typepad%2Ftheaccountingonion+%28The+Accounting+Onion%29
Jensen Comment
His latest posting remains, however, disappointing to me in that he does not
delve into how traditional replacement (current) cost accounting of operating
assets like factories, stores, hotels, airliners, can be more misleading than
helpful if it is not accompanied by traditional historical cost financial
statements and possibly exit value statements (although exit value is not very
relevant for going concerns with lots of synergy covariances of asset values "in
use."
Some of his statements do not adequately stress that replacement cost
accounting is not value accounting since it has identical accrual issues of
depreciation, depletion, amortization, bad debt estimation, etc. that plagues
historical cost accounting. For example, he states:
"First, replacement cost measures are the only
possible way for accounting to reflect wealth invested by shareholders in an
enterprise; and consequently, changes in invested wealth."
Tom Selling as cited
above
Firstly, I almost always advise against sweeping generalization such as the
"only possible way to reflect wealth invested by shareholders ..."
Such sweeping generalizations should be avoided in the Academy, especially when
when our accounting history research literature is brimming articles from
scholars who do not share Tom's view about replacement cost accounting (even in
theory). Kenneth McNeal would not call replacement cost accounting "Truth in
Accounting" or even being the best of asset measurement alternatives ---
http://www.trinity.edu/rjensen/Theory02.htm#BasesAccounting
Secondly, he still is speaking of "flowers in spring" to Julie Andrews
without giving her the "show me" she's demanding. He still has not made a
convincing case on how even his hybrid version of replacement cost accounting
would be relevant to my two Holiday Inn case seeds at
http://www.cs.trinity.edu/~rjensen/temp/HolidayInnCaseSeeds.htm
To his credit, in his latest posting Tom does not mention Tobin's Q. Perhaps
I convinced him that Tobin's Q is just not relevant to this analysis since the
value of a firm is affected by so many factors other than items accountants book
into the ledgers. I discuss this problem with Tobin's Q at
http://www.cs.trinity.edu/~rjensen/temp/HolidayInnCaseSeeds.htm
In any case I hope Tom will continue our debate on replacement costs. My
challenge to him remains to take my two Holiday Inn case seeds and show how
replacement cost measures "are the only possible way
for accounting to reflect wealth invested by shareholders in an enterprise; and
consequently, changes in invested wealth" in these two hotels.
http://www.cs.trinity.edu/~rjensen/temp/HolidayInnCaseSeeds.htm
February 7, 2013 Update
From PwC on February 5, 2013
Reporting of Amounts Reclassified Out of Accumulated Other Comprehensive
Income
On February 5, 2013, the Financial Accounting Standards Board (FASB) issued
Accounting Standards Update No. 2013-02, Reporting of Amounts Reclassified Out
of Accumulated Other Comprehensive Income. This guidance is the culmination of
the board's redeliberation on reporting reclassification adjustments from
accumulated other comprehensive income. The new requirements will take effect
for public companies in interim and annual reporting periods beginning after
December 15, 2012 (the first quarter of 2013 for public, calendar-year
companies).
http://www.pwc.com/en_US/us/cfodirect/assets/pdf/in-brief/in-brief-2013-05-fasb-other-comprehensive-income.pdf
Question
If the media insists on reporting one earnings number, which of the alternative
earnings numbers should be reported?
In particular, should net earnings be reported before or after remeasuring
financial instruments for unrealized changes in fair value?
Hint
The following paper has a great summary of the history of OCI and problems
facing the FASB and IASB as we look to the future of financial reporting of
business firms.
"Academic Research and Standard-Setting: The Case of Other Comprehensive
Income," by Lynn L. Rees and Philip B. Shane, Accounting Horizons,
December 2012, Vol. 26, No. 4, pp. 789-815. ---
http://aaajournals.org/doi/full/10.2308/acch-50237
This paper links academic accounting research on
comprehensive income reporting with the accounting standard-setting efforts
of the Financial Accounting Standards Board (FASB) and the International
Accounting Standards Board (IASB). We begin by discussing the development of
reporting other comprehensive income, and we identify a significant weakness
in the FASB's Conceptual Framework, in the lack of a cohesive definition of
any subcategory of comprehensive income, including earnings. We identify
several attributes that could help allocate comprehensive income between net
income, other comprehensive income, and other subcategories. We then review
academic research related to remaining standard-setting issues, and identify
gaps in academic research where hypotheses could be developed and tested.
Our objectives are to (1) stimulate standard-setters to better conceptualize
what is meant by other comprehensive income and to distinguish it from
earnings, and (2) stimulate researchers to develop and test hypotheses that
might help in that process.
. . .
Potential Alternative Definitions of Earnings
Table 1 summarizes and categorizes various
standard-setting issues related to reporting comprehensive income, and
provides the organizing structure for our literature review later in the
paper. The most important of these issues is the definition of earnings, or
what makes up earnings and how it is distinguished from OCI. This is a
“cross-cutting” issue because it arises when the Boards deliberate on
various topics. The Boards cooperatively initiated the financial statement
presentation project intending, in part, to solve the comprehensive income
composition problem, but the project was subsequently delayed.
Table 2 presents a list of the specific
comprehensive income components under current U.S. GAAP that require
recognition as OCI. The second column presents the statement that provided
financial reporting guidance for the OCI component, along with its effective
date. The effective dates provide an indication as to how the OCI components
have expanded over time. Since the issuance of Statement No. 130, which
established formal reporting of OCI, new OCI-expanding requirements were
promulgated in Statement No. 133. Financial instruments, insurance, and
leases are three examples of topics currently on the FASB's agenda where OCI
has been discussed as an option to report various gains and losses. In all
these discussions, a framework is lacking that can guide standard-setter
decisions. The increased use of accumulated OCI to capture various changes
in net assets and the likely expansion of OCI items reinforce the notion
that standard-setters must eventually come to grips with the distinction
between OCI and earnings, or even whether the practice of reporting OCI with
recycling should be retained.7
Presumably, elements with similar informational
attributes should be classified together in financial statements. It is
unclear what attributes the items listed in Table 2 possess that result in
their being characterized differently from other components of income.
Notably, the basis for conclusions of the FASB standards gives little to no
economic reasoning for the decision to place these items in OCI. While not
exhaustive, Table 2 presents four attributes that standard-setters could
potentially use to distinguish between earnings and OCI: (1) the degree of
persistence of the item, (2) whether the item results from a firm's core
operations, (3) whether the item represents a change in net assets that is
reasonably within management's control, and (4) whether the item results
from remeasurement of an asset/liability. We discuss in turn the merits and
potential problems of using these attributes to form a reporting framework
for comprehensive income.
Degree of Persistence.
The degree of persistence of various comprehensive
income components has significant implications for firm value (e.g.,
Friedman 1957; Kormendi and Lipe 1987; Collins and Kothari 1989). Ohlson's
(1995, 1999) valuation model places a heavy emphasis on earnings
persistence, which suggests that a reporting format that facilitates
identifying the level of persistence across income components could be
useful to investors. Examples abound as to how the concept of income
persistence has been used in standard-setting, including separate
presentation in the income statement for one-time items, extraordinary
items, and discontinued operations. Standard-setters have justified several
footnote disclosures (segmental disclosures) and disaggregation requirements
(e.g., components of pension expense) on the basis of providing information
to financial statement users about the persistence of various income
statement components.
Thus, the persistence of revenue and expense items
potentially could serve as a distinguishing characteristic of earnings and
OCI. Table 2 shows that we regard all the items currently recognized in OCI
as having relatively low persistence. However, several other low-persistence
items are not recognized in OCI; for example, gains/losses on sale of
assets, impairments of assets, restructuring charges, and gains/losses from
litigation. To be consistent with this definition of OCI, the current
paradigm must change significantly, and the resulting total for OCI would
look substantially different from what it is now.
Using persistence of an item to distinguish
earnings from OCI would create significant problems for standard-setters.
Persistence can range from completely transitory (zero persistence) to
permanent (100 percent persistence). At what point along this range is an
item persistent enough to be recorded in earnings? While restructuring
charges are typically considered as having low persistence, if they occur
every two to three years, is this frequent enough to be classified with
other earnings components or infrequent enough to be classified with OCI?
Furthermore, the relative persistence of an item likely varies across
industries, and even across firms.
In spite of these inherent difficulties,
standard-setters could establish criteria related to persistence that they
might use to ultimately determine the classification of particular items. In
addition, standard-setters would not be restricted to classifying income
components in one of two categories. As an example, highly persistent
components could be classified as part of “recurring earnings,”
medium-persistence items could go to “other earnings,” and low-persistence
items to OCI (or some other nomenclature). Standard-setters could create
additional partitions as needed.
Core Operations.
Classifying income components as earnings or OCI
based on whether they are part of a firm's core operations is intuitively
appealing. This criterion is related to income persistence, as we would
expect core earnings to be more persistent than noncore income items.
Furthermore, classifying income based on whether it is part of core
operations has a long history in accounting.
In current practice, companies and investors place
primary importance on some variant of earnings. However, it is not clear
which variant of earnings is superior. Many companies report pro forma net
income, which presumably provides investors with a more representative
measure of the company's core income, but definitions of pro forma earnings
vary across firms. Similarly, analysts tend to forecast a company's core
earnings (Gu and Chen 2004). Evidence in prior research indicates that pro
forma earnings and actual earnings forecasted by analysts are more closely
associated with share prices than income from continuing operations based on
current U.S. GAAP (e.g., Bradshaw and Sloan 2002; Bhattacharya et al. 2003).
The problems inherent with this attribute are
similar to those of the earnings-persistence criterion. No generally
accepted definition of core operations exists. At what point along a
continuum does an activity become part of the core operations of a business?
As Table 2 indicates, classifying gains/losses from holding
available-for-sale securities as part of core earnings depends on whether
the firm operates in the financial sector. Different operating environments
across firms and industries could make it difficult for standard-setters to
determine whether an item belongs in core earnings or OCI.8 In addition,
differences in application across firms may give rise to concerns about
comparability and potential for abuse on the part of managers in exercising
their discretion (e.g., Barth et al. 2011).
The FASB's (2010) Staff Draft on Financial
Statement Presentation tries to address the definitional issue by using
interrelationships and synergies between assets and liabilities as a
criterion to distinguish operating (or core) activities from investing (or
noncore) activities. Specifically, the Staff Draft states:
An entity shall classify in the operating category:
Assets that are used as part of the entity's
day-to-day business and all changes in those assets Liabilities that arise
from the entity's day-to-day business and all changes in those liabilities.
Operating activities generate revenue through a
process that requires the interrelated use of the entity's resources. An
asset or a liability that an entity uses to generate a return and any change
in that asset or liability shall be classified in the investing category. No
significant synergies are created for the entity by combining an asset or a
liability classified in the investing category with other resources of the
entity. An asset or a liability classified in the investing category may
yield a return for the entity in the form of, for example, interest,
dividends, royalties, equity income, gains, or losses. (FASB 2010, paras.
72, 73, 81)
The above distinction between operating activities
and investing activities could similarly be used to distinguish between core
activities and noncore activities. Alternatively, standard-setters might
develop other definitions. Similar to the degree of persistence attribute,
standard-setters would not be restricted to a simple core versus noncore
dichotomy when using this definition.
Another possible solution is to allow management to
determine which items belong in core earnings. Companies exercise this
discretion today when they choose to disclose pro forma earnings.
Furthermore, the FASB established the precedent of the “management approach”
when it allowed management to determine how to report segment disclosures.
In several other areas of U.S. GAAP, management is responsible for
establishing boundaries that define its operating environment. FASB
Accounting Standards Codification Topic 320 (formerly Statement 115) permits
different measurements for identical investments based on management's
intent to sell or hold the instrument. Other examples where U.S. GAAP allows
for management discretion include determining the rate to discount pension
liabilities, defining reporting units, and determining whether an impairment
is other than temporary. However, the management approach accentuates the
concern about comparability and potential for abuse.
Management Control.
Given a premise that evaluating management's
stewardship is a primary role of financial statements, a possible rationale
for excluding certain items from earnings is that they do not provide a good
measure to evaluate management.9 Management can largely control the firm's
operating costs and can influence the level of revenues generated. However,
some decisions that affect comprehensive income can be established by
company policy or the company mission statement and, thus, be outside the
control of management. For example, a company policy might be to invest
excess cash in marketable securities with the objective of maximizing
returns. Once the board of directors establishes this policy, management has
little influence over how market-wide fluctuations in security prices affect
earnings, and hedging the gains/losses would be inconsistent with the
objective of maximizing returns. Similarly, a company's mission statement
might include expansion overseas, or prior management might have already
decided to establish a foreign subsidiary. The resulting gains/losses from
foreign currency fluctuations would seemingly be out of management's
control, and hedging these gains/losses would not make economic sense if the
subsidiary's functional currency is its local currency and the parent has no
intention of repatriating the subsidiary's cash flows.
Of course, determining what is and is not
ostensibly under management's control becomes highly subjective and would
probably differ across industries, and perhaps even across firms within
industries. For example, gains/losses from investment holdings might not be
relevant in evaluating management of some companies, but might be very
relevant for managers of holding companies. In addition, the time horizon
affects what is under management's control. That is, as the time horizon
lengthens, more things are under management's control.
In Table 2, we classify items as not under
management's control if they are based on fluctuations in stock prices or
exchange rates, which academic research shows to be largely random within
efficient markets. Using this classification model, most, but not all, of
the OCI items listed in Table 2 are classified as not under the management's
control. Some of the pension items currently recognized in OCI are within
the control of management, because management controls the decision to
revise a pension plan. While management has control over when to harvest
gains/losses on available-for-sale (AFS) securities by deciding when to sell
the securities, it cannot control market prices. Thus, under this criterion,
unrealized gains/losses on AFS securities are appropriately recognized in
OCI. However, gains/losses on trading securities and the effects of tax rate
changes are beyond management's control, and yet, these items are currently
included as part of earnings. Thus, “management control” does not
distinguish what is and is not included in earnings under current U.S. GAAP.
Remeasurements.
Barker (2004) explains how the measurement and
presentation of comprehensive income might rely on remeasurements. The
FASB's (2010) Staff Draft on Financial Statement Presentation defines
remeasurements as follows:
A remeasurement is an amount recognized in
comprehensive income that increases or decreases the net carrying amount of
an asset or a liability and that is the result of:
A change in (or realization of) a current price or
value A change in an estimate of a current price or value or A change in any
estimate or method used to measure the carrying amount of an asset or a
liability. (FASB 2010, para. 234)
Using this definition, examples of remeasurements
are impairments of land, unrealized gains/losses due to fair value changes
in securities, income tax expenses due to changes in statutory tax rates,
and unexpected gains/losses from holding pension assets. All of these items
represent a change in carrying value of an already existing asset or
liability due to changes in prices or estimates (land, investments, deferred
tax asset/liability, and pension asset/liability, respectively).
Table 3 reproduces a table from Barker (2004) that
illustrates how a firm's income statement might look using a “matrix format”
if standard-setters adopt the remeasurement approach to reporting
comprehensive income. Note that the presentation in Table 3 does not employ
earnings as a subtotal of comprehensive income; however, the approach could
be modified to define earnings as the sum of all items before remeasurements,
if considered useful. Tarca et al. (2008) conduct an experiment with
analysts, accountants, and M.B.A. students to assess whether the matrix
income statement format in Table 3 facilitates or hinders users' ability to
extract information. They find evidence suggesting that the matrix format
facilitates more accurate information extraction for users across all
sophistication levels relative to a typical format based on IAS 1.
Table 3: Illustration of Matrix Reporting Format
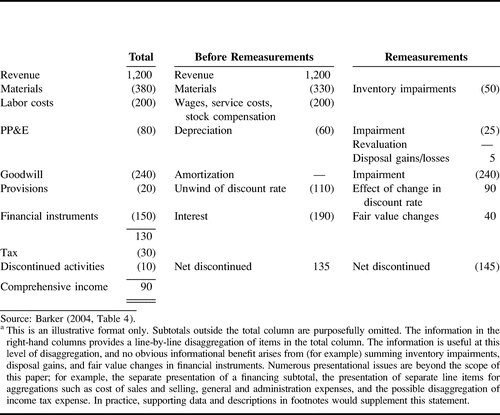
Employing remeasurements to distinguish between
earnings and other comprehensive income largely incorporates the criterion
of earnings persistence. Most remeasurements result from price changes,
where the current change has little or no association with future changes
and, therefore, these components of income are transitory. In contrast,
earnings components before remeasurements generally represent items that are
likely more persistent.
Perhaps the most significant advantage of the
remeasurement criterion is that it is less subjective than the other
criteria previously discussed. Most of the other criteria in Table 2 are
continuous in nature. Drawing a bright line to differentiate what belongs in
earnings from what belongs in OCI is challenging and will likely be
susceptible to income manipulation. In contrast, determining whether a
component of income arises from a remeasurement is more straightforward.
Yet another advantage of this approach is it allows
for a full fair value balance sheet that clearly discloses the effects of
fair value measurement on periodic comprehensive income, while also showing
earnings effects under a modified historical cost system (i.e., before
remeasurements). This approach could potentially provide better information
about probable future cash flows.
Other.
The attributes standard-setters could use to
classify income components into earnings or OCI are not limited to the list
in Table 2. Ketz (1999) suggests using the level of measurement uncertainty.
As an example, gains/losses from Level 1 fair value measurements might be
viewed as sufficiently certain to include in earnings, while Level 3 fair
value measurements might generate gains/losses that belong in OCI. Song et
al. (2010) provide some support for this partition in that they document the
value relevance of Level 1 and Level 2 fair values exceeds the value
relevance of Level 3 fair values.
Another potential attribute might be the horizon
over which unrealized gains/losses are ultimately realized. That is,
unrealized gains/losses from foreign currency fluctuations, term life
insurance contracts, or holding pension assets that will not be realized for
many years in the future might be disclosed as part of OCI, whereas
unrealized gains/losses from trading and available-for-sale securities could
be part of earnings.
As previously discussed, the attributes of
measurement uncertainty and timeliness create similar problems in
determining where to draw the line. Which items are sufficiently reliable
(or timely) to include in earnings, and will differences in implementation
across firms and industries impair comparability?
The overriding purpose of the discussion in this
subsection is to point out that several alternative attributes could
potentially guide standard-setters in establishing criteria to differentiate
earnings from OCI. Ultimately, the choice regarding whether/how to
distinguish net income from OCI is a matter of policy. However, academic
research can inform policy decisions, as described in the fourth and fifth
sections.
Summary
Reporting OCI is a relatively recent phenomenon
that presumes financial statement users are provided with better information
when specific comprehensive income components are excluded from
earnings-per-share (EPS), and recycled back into net income only after the
occurrence of a specified transaction or event. The number of income
components included in OCI has increased over time, and this expansion is
likely to continue as standard-setters address new agenda items (e.g.,
financial instruments and insurance contracts). The lack of a clear
definitional distinction between earnings and OCI in the FASB/IASB
Conceptual Frameworks has led to: (1) ad hoc decisions on the income
components classified in OCI, and (2) no conceptual basis for deciding
whether OCI should be excluded from earnings-per-share (EPS) in the current
period or recycled through EPS in subsequent periods. In this section, we
discussed alternative criteria that standard-setters could use to
distinguish earnings from OCI, along with the advantages and challenges of
each criterion. Further, due to the inherent difficulties in drawing bright
lines between earnings that are persistent versus transitory, core versus
noncore, under management control or not, and amenable to remeasurement or
not, standard-setters might consider eliminating OCI; that is, they might
decide to adopt an all-inclusive income statement approach, where
comprehensive income is reporte
. . .
Continued in article
Jensen Comment
I like this paper. Table 3 could be improved by adding bottom line net earnings
before and after remeasurement.
The paper does not provide all the answers, but it is well written in terms
of history up to this point in time and alternative directions for
consideration.
No Bottom Line
Question
Is a major overhaul of accounting standards on the way?
Hint
There may no longer be the tried and untrusted earnings per share number to
report!
Comment
It would be interesting to see a documentation of the academic research, if any,
that the FASB relied upon to commence this blockbuster initiative. I recommend
that some astute researcher commence to probe into the thinking behind this
proposal.
"Profit as We Know It Could Be Lost With New Accounting
Statements," by David Reilly, The Wall Street Journal, May 12, 2007; Page
A1 ---
http://online.wsj.com/article/SB117893520139500814.html?mod=DAT
Pretty soon the bottom line may not be, well, the
bottom line.
In coming months, accounting-rule makers are
planning to unveil a draft plan to rework financial statements, the bedrock
data that millions of investors use every day when deciding whether to buy
or sell stocks, bonds and other financial instruments. One possible result:
the elimination of what today is known as net income or net profit, the
bottom-line figure showing what is left after expenses have been met and
taxes paid.
It is the item many investors look to as a key
gauge of corporate performance and one measure used to determine executive
compensation. In its place, investors might find a number of profit figures
that correspond to different corporate activities such as business
operations, financing and investing.
Another possible radical change in the works:
assets and liabilities may no longer be separate categories on the balance
sheet, or fall to the left and right side in the classic format taught in
introductory accounting classes.
ACCOUNTING OVERHAUL
Get a glimpse of what new financial statements
could look like, according to an early draft recently provided by the
Financial Accounting Standards Board to one of its advisory groups. The
overhaul could mark one of the most drastic changes to accounting and
financial reporting since the start of the Industrial Revolution in the 19th
century, when companies began publishing financial information as they
sought outside capital. The move is being undertaken by accounting-rule
makers in the U.S. and internationally, and ultimately could affect
companies and investors around the world.
The project is aimed at providing investors with
more telling information and has come about as rule makers work to one day
come up with a common, global set of accounting standards. If adopted, the
changes will likely force every accounting textbook to be rewritten and
anyone who uses accounting -- from clerks to chief executives -- to relearn
how to compile and analyze information that shows what is happening in a
business.
This is likely to come as a shock, even if many
investors and executives acknowledge that net income has flaws. "If there
was no bottom line, I'd want to have a sense of what other indicators I
ought to be looking at to get a sense of the comprehensive health of the
company," says Katrina Presti, a part-time independent health-care
contractor and stay-at-home mom who is part of a 12-woman investment club in
Pueblo, Colo. "Net income might be a false indicator, but what would I look
at if it goes away?"
The effort to redo financial statements reflects
changes in who uses them and for what purposes. Financial statements were
originally crafted with bankers and lenders in mind. Their biggest question:
Is the business solvent and what's left if it fails? Stock investors care
more about a business's current and future profits, so the net-income line
takes on added significance for them.
Indeed, that single profit number, particularly
when it is divided by the number of shares outstanding, provides the most
popular measure of a company's valuation: the price-to-earnings ratio. A
company that trades at $10 a share, and which has net profit of $1 a share,
has a P/E of 10.
But giving that much power to one number has long
been a recipe for fraud and stock-market excesses. Many major accounting
scandals earlier this decade centered on manipulation of net income. The
stock-market bubble of the 1990s was largely based on investors' assumption
that net profit for stocks would grow rapidly for years to come. And the
game of beating a quarterly earnings number became a distraction or worse
for companies' managers and investors. Obviously it isn't known whether the
new format would cut down on attempts to game the numbers, but companies
would have to give a more detailed breakdown of what is going on.
The goal of the accounting-rule makers is to better
reflect how businesses are actually run and divert attention from the one
number. "I know the world likes single bottom-line numbers and all of that,
but complicated businesses are hard to translate into just one number," says
Robert Herz, chairman of the Financial Accounting Standards Board, the U.S.
rule-making body that is one of several groups working on the changes.
At the same time, public companies today are more
global than local, and as likely to be involved in services or lines of
business that involve intellectual property such as software rather than the
plants and equipment that defined the manufacturing age. "The income
statement today looks a lot like it did when I started out in this
profession," says William Parrett, the retiring CEO of accounting firm
Deloitte Touche Tohmatsu, who started as a junior accountant in 1967. "But
the kind of information that goes into it is completely different."
Along the way, figures such as net income have
become muddied. That is in part because more and more of the items used to
calculate net profit are based on management estimates, such as the value of
items that don't trade in active markets and the direction of interest
rates. Also, over the years rule makers agreed to corporate demands to
account for some things, such as day-to-day changes in the value of pension
plans or financial instruments used to protect against changes in interest
rates, in ways that keep them from causing swings in net income.
Rule makers hope reformatting financial statements
will address some of these issues, while giving investors more information
about what is happening in different parts of a business to better assess
its value. The project is being managed jointly by the FASB in the U.S. and
the London-based International Accounting Standards Board, and involves
accounting bodies in Japan, other parts of Asia and individual European
nations.
The entire process of adopting the revised approach
could take a few years to play out, so much could yet change. Plus, once
rule makers adopt the changes, they would have to be ratified by regulatory
authorities, such as the Securities and Exchange Commission in the U.S. and
the European Commission in Europe, before public companies would be required
to follow them.
As a first step, rule makers expect later this year
to publish a document outlining their preliminary views on what new form
financial statements might take. But already they have given hints of what's
in store. In March, the FASB provided draft, new financial statements at the
end of a 32-page handout for members of an advisory group. (See an example.)
Although likely to change, this preview showed an
income statement that has separate segments for the company's operating
business, its financing activities, investing activities and tax payments.
Each area has an income subtotal for that particular segment.
There is also a "total comprehensive income"
category that is wider ranging than net profit as it is known today, and so
wouldn't be directly comparable. That is because this total would likely
include gains and losses now kept in other parts of the financial
statements. These include some currency fluctuations and changes in the
value of financial instruments used to hedge against other items.
Comprehensive income could also eventually include
short-term changes in the value of corporate pension plans, which currently
are smoothed out over a number of years. As a result, comprehensive income
could be a lot more difficult to predict and could be volatile from quarter
to quarter or year to year.
As for the balance sheet, the new version would
group assets and liabilities together according to similar categories of
operating, investing and financing activities, although it does provide a
section for shareholders equity. Currently, a balance sheet is broken down
between assets and liabilities, rather than by operating categories.
Such drastic change isn't likely to happen without
a fight. Efforts to bring now-excluded figures into the income statement
could prompt battles with companies that fear their profit will be subject
to big swings. Companies may also balk at the expense involved.
"The cost of this change could be monumental," says
Gary John Previts, an accounting professor at Case Western Reserve
University in Cleveland. "All the textbooks are going to have to change,
every contract and every bank arrangement will have to change." Investors in
Europe and Asia, meanwhile, have opposed the idea of dropping net profit as
it appears today, David Tweedie, the IASB's chairman, said in an interview
earlier this year.
Analysts in the London office of UBS AG recently
published a report arguing this very point -- that even if net income is a
"simplistic measure," that doesn't mean it isn't a valid "starting point in
valuation" and that "its widespread use is justification enough for its
retention."
Such opposition doesn't surprise many accounting
experts. Net income is "the basis for bonuses and judgments about what a
company's stock is worth," says Stephen A. Zeff, an accounting professor at
Rice University. "I just don't know what the markets would do if companies
stopped reporting a bottom line somewhere." In the U.S., professional
investors and analysts have taken a more nuanced view, perhaps because the
manipulation of numbers was more pronounced in U.S. markets.
That said, net profit has been around for some
time. The income statement in use today, along with the balance sheet,
generally dates to the 1940s when the SEC laid out regulations on financial
disclosure. But many companies have included net profit in one form or
another since the 1800s.
In its fourth annual report, General Electric Co.
provided investors with a consolidated balance sheet and consolidated
profit-and-loss account for the year ended Jan. 31, 1896. The company, whose
board at the time included Thomas Edison, generated "profit of the year" --
what today would be called net income or net profit -- of $1,388,967.46.
For the moment, net profit will probably exist in
some form, although its days are likely numbered. "We've decided in the
interim to keep a net-income subtotal, but that's all up for discussion,"
the FASB's Mr. Herz says.
Bob Jensen's summary of accounting theory is at
http://www.trinity.edu/rjensen/Theory01.htm
Question
What do CFO's think of Robert Herz's (Chairman of the FASB) radical proposed
format for financial statements that have more disaggregated financial
information and no aggregated bottom line?
As we moved to fair value accounting for
derivative financial instruments (FAS 133) and financial instruments (FAS 157
and 159) coupled with the expected new thrust for fair value reporting on the
international scene, we have filled the income statement and the retained
earnings statement with more and more instability due to fluctuating unrealized
gains and losses.
I have reservations about fair value reporting
---
http://www.trinity.edu/rjensen/Theory01.htm#FairValue
But if we must live with more and more fair
value reporting, the bottom line has to go. But CFOs are reluctant to give up
the bottom line even if it may distort investing decisions and compensation
contracts tied to bottom-line reporting.
Before reading the article below you may want to first read about radical
new changes on the way ---
http://www.trinity.edu/rjensen/Theory01.htm#ChangesOnTheWay
- "A New Vision for
Accounting: Robert Herz and FASB are preparing a
radical new format for financial, CFO Magazine,
by Alix Stuart, February 2008, pp. 49-53 ---
http://www.cfo.com/article.cfm/10597001/c_10711055?f=home_todayinfinance
Last summer, McCormick & Co. controller Ken Kelly sliced
and diced his financial statements in ways he had never
before imagined. For starters, he split the income
statement for the $2.7 billion international
spice-and-food company into the three categories of the
cash-flow statement: operating, financing, and
investing. He extracted discontinued operations and
income taxes and placed them in separate categories,
instead of peppering them throughout the other results.
He created a new form to distinguish which changes in
income were due to fair value and which to cash. One
traditional ingredient, meanwhile, was conspicuous by
its absence: net income.
Kelly wasn't just indulging a whim. Ahead of a public
release of a draft of the Financial Accounting Standards
Board's new format for financial statements in the
second quarter of 2008, the McCormick controller was
trying out the financial statements of the future, a
radical departure from current conventions. FASB's
so-called financial statement presentation project is
ostensibly concerned only with the form, or the "face,"
of financial statements, but it's quickly becoming clear
that it will change and expand their content as well.
"This is a complete redefinition of the financial
statements as we know them," says John Hepp, a former
FASB project manager and now senior manager at Grant
Thornton.
Some of the major changes under discussion:
reconfiguring the balance sheet and the income statement
to follow the three categories of the cash-flow
statement, requiring companies to report cash flows with
the little-used direct method; and introducing a new
reconciliation schedule that would highlight fair-value
changes. Companies will also likely have to report more
about their segments, possibly down to the same level of
detail as they currently report for the consolidated
statements. Meanwhile, net income is slated to disappear
completely from GAAP financial statements, with no
obvious replacement for such commonly used metrics as
earnings per share.
FASB, working with the International Accounting
Standards Board (IASB) and accounting standards boards
in the United Kingdom and Japan, continues to work out
the precise details of the new financial statements. "We
are trying to set the stage for what financial
statements will look like across the globe for decades
to come," says FASB chairman Robert Herz. (Examples of
the proposed new financial statements can be viewed at
FASB's Website.) If the standard-setters stay their
course, CFOs and controllers at every publicly traded
company in the world could be following Kelly's lead as
soon as 2010.
It's too early to predict with confidence which changes
will ultimately stick. But the mock-up exercise has made
Kelly wary. He considers the direct cash-flow statement
and reconciliation schedule among the "worst aspects" of
the forthcoming proposal, and expects they would require
"draconian exercises" from his finance staff, he says.
And he questions what would result from the additional
details: "If all of a sudden your income statement has
125 lines instead of 25, is that presentation more
clarifying, or more confusing?"
Other financial executives share Kelly's skepticism. In
a December CFO survey of more than 200 finance
executives, only 17 percent said the changes would offer
any benefits to their companies or investors (see "Keep
the Bottom Line" at the end of this article). Even some
who endorsed the basic aim of the project and like the
idea of standardizing categories across the three major
financial statements were only cautiously optimistic.
"It may be OK, or it may be excessive." says David
Rickard, CFO of CVS/Caremark. "The devil will be in the
details."
Net Loss From the outset, corporate financial officers
have been ambivalent about FASB's seven year-old
project, which was originally launched to address
concerns that net income was losing relevance amid a
proliferation of pro forma numbers. Back in 2001,
Financial Executives International "strongly opposed"
it, while executives at Philip Morris, Exxon Mobil,
Sears Roebuck, and Microsoft protested to FASB as well.
(Critics then and now point out that FASB will have
little control over pro forma reporting no matter what
it does. Indeed, nearly 60 percent of respondents to
CFO's survey said they would continue to report pro
forma numbers after the new format is introduced.)
Given the project's starting point, it's not surprising
that current drafts of the future income statement omit
net income. Right now that's by default, since income
taxes are recorded in a separate section. But there is a
big push among some board members to make a more
fundamental change to eliminate net income by design,
and promote business income (income from operations) as
the preferred basis for investment metrics.
"If net income stays, it would be a sign that we
failed," says Don Young, a FASB board member. In his
mind, the project is not merely about getting rid of net
income, but rather about capturing all income-related
information in a single line (including such volatile
items as gains and losses on cash-flow hedges,
available-for-sale securities, and foreign-exchange
translations) rather than footnoting them in other
comprehensive income (OCI) as they are now. "All changes
in net assets and liabilities should be included," says
Young. "Why should the income statement be incomplete?"
He predicts that the new subtotals, namely business
income, will present "a much clearer picture of what's
going on."
Board member Thomas Linsmeier agrees. "The rationale for
segregating those items [in OCI] is not necessarily
obvious, other than the fact that management doesn't
want to be held accountable for them in the current
period," he says.
Whether for self-serving or practical reasons, finance
chiefs are rallying behind net income. Nearly 70 percent
of those polled by CFO in December said it should stay.
"I understand their theories that it's not the be-all
and end-all measure that it's put up to be, but it is a
measure everyone is familiar with, and sophisticated
users can adjust from there," says Kelly. Adds Rickard:
"They're treating [net income] as if it's the scourge of
the earth, which to me is silly. I think the logical
conclusion is to make other things available, rather
than hiding the one thing people find most useful."
. . .
Bob Jensen's threads on this
proposed "radical change" in financial reporting are at
http://www.trinity.edu/rjensen/Theory01.htm#ChangesOnTheWay
Jensen Comment
As we moved to fair value accounting for derivative
financial instruments (FAS 133) and financial instruments (FAS
157 and 159) coupled with the expected new thrust for fair
value reporting on the international scene, we have filled
the income statement and the retained earnings statement
with more and more instability due to fluctuating unrealized
gains and losses.
I have reservations about
fair value reporting ---
http://www.trinity.edu/rjensen/Theory01.htm#FairValue
But if we must live with
more and more fair value reporting, the bottom line has to
go. But CFOs are reluctant to give up the bottom line even
if it may distort investing decisions and compensation
contracts tied to bottom-line reporting.
Bob Jensen's threads on the radical new changes on the
way ---
http://www.trinity.edu/rjensen/Theory01.htm#ChangesOnTheWay